
Lesson 7- Additional Indicators
![]()
Learning Objectives
This lesson covers additional indicators that should be evaluated as you move about the wetland. These are not necessarily tied to the transects or plots but will give a more fulsome picture of the health and condition of the wetland.
In this lesson, you will learn:
- Additional indicators related to vegetation to watch out for
- Hydrological indicators that could affect the condition of the wetland
Additional Vegetation Indicators
While walking the transects, it is important to record notes or mental observations pertaining to additional vegetation indicators. You will use Table 7.4. to record continuous observations for vegetation within the wetland and 10m upland.
Long-term Trajectory of The Climax Plant Community
You will consider the percent of the assessment area that represents long term impacts on the plant community due to a disturbance, specifically changes that will alter the trajectory of the vegetation of the community over the long term. Large tree growth is often confined to raised microsites in wetlands, but when harvesting removes the canopy, the water table can rise and reduce the microsites that are otherwise dry enough to support trees. In other circumstances, when areas are cleared, they may become more frost prone and cause seedling mortality due to frosts during the growing season. Such observations should be recorded as affecting the long-term trajectory of the vegetation community at the site. In other circumstances, conversion of the site to lawns, agricultural fields, or planting of non-native trees can affect the site’s long-term trajectory.
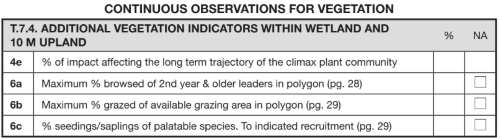
Browsing of 2nd Year & Older Leaders in Polygon
Browsing of second year or older material affects the overall health of the plant and continual high use will affect the ability of the plant to maintain itself on the site. Here, heavy browse is recorded when more than half of second year and older leaders are browsed. Leaders are long thin branches that grow from the stem of a bush or tree beyond other branches.
Check the branches of any woody shrubs that would be within reach of animals for evidence of browse. A shrub or tree that appears to have unusually compact branches or is umbrella shaped is an indication of heavy browse. If stems have recently been chewed by beaver, it should be counted.
Photos: Examples of heavy browse
Palatable Species
This indicator is not applicable if the site lacks potential for trees or shrubs; for example, the site is a cattail marsh or herbaceous wet meadow. Not all wetland areas can support trees and/or shrubs; however, on those sites where such species do belong, they play important roles.
In heavily browsed areas, there may be under-representation of palatable species such as Thuja plicata (Western redcedar), Salix species (willows), Cornus stolonifera (red-osier dogwood), and Amelanchier alnifolia (Saskatoon). You may also see overrepresentation of less-palatable species, including:
- Crategus spp. (hawthorn);
- Elaegnus commutata (silverberry/wolf willow);
- Dasiphora fruticosa or Potentilla fruticosa (shrubby cinquefoil);
- Rosa spp. (rose);
- Symphoricarpos spp. (buckbrush/snowberry.
Seedlings or saplings of palatable tree and shrub species should make up more than 5% of those species in the entire polygon.
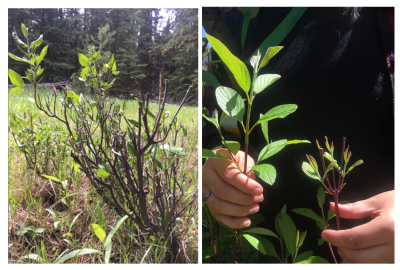
Heavily Grazed Areas
Heavy grazing can lead to undesirable invaders inhabiting the site as the native plants are prevented from flowering and are often extirpated. The polygon should be considered free of heavy grazing if 90% or more of the available forage has a stubble height greater than the recommended minimum (usually 5cm or 2 inches for most ranges). Consider heavy grazing present only if short stubble remains, almost all plant biomass has been removed, and only the root systems and parts of the stems remain. Do not count dead plants unless it is clear that death resulted from overgrazing.
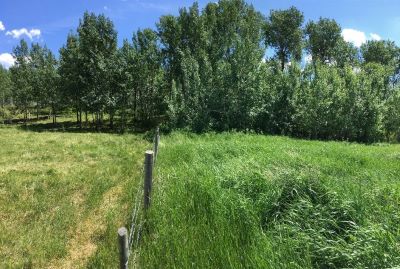
Photo: Heavy grazing prevented near a wetland that was fenced off.
Physical and Hydrological Alteration
Consider any “hardscaping” that has involved the deposition or removal of soils or other materials within the assessment area. We are interested in the accumulated effects of all physical and hydrological alterations (both natural disturbances and human caused). The indicators are used to assess physical change to the soil, bank/shore integrity, hydrology, etc. as it affects the ability of the natural system to function normally.
Photo: Corduroy road on top of wetland for machinery crossing inside a wetland (Note: boundaries of wetland not properly delineated)
Hydrologic changes include modifications to the hydroperiod of the wetland in terms of quantity and timing of water inputs. Roads, ditches, dams, and land-clearing can potentially alter the hydrology of the site and lead to shifted plant communities or a non-functioning wetland. Dead trees and shrubs around the perimeter are a strong indicator of a change in hydrology. Conversely, the presence of younger trees in a wetland, can indicate that the site is drying out or shrinking.
Four categories of alteration severity are described in the Protocol and wetlands technical guidance document. These relate to change in the site vegetation and hydrologic function. An example of severe alteration is seen in the photo below.
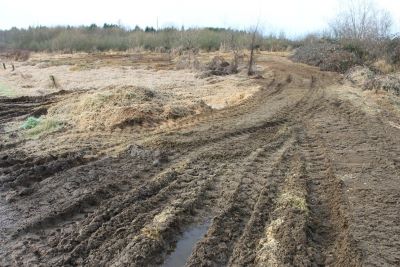
Photo: Haul road constructed within a wetland.
Stream Channels
A stream flowing through a wetland should be checked for structural stability as it is linked to the hydrology of the wetland. The stream may periodically flood the surrounding wetland or maintain subsurface groundwater levels. Channel incisement, if moderate or severe, can remove the stream channel’s connectivity to its floodplain, and increase the drainage of subsurface groundwater levels. Many shrubs as well as sedges often have deep root masses that help reduce streambank erosion and downcutting. You will estimate whether there is any channel incisement, as well as the percent of the stream that contains deep binding root mass.
You will also indicate whether there has been recent or historical disturbance to the stream channel, such as drainage tiles (e.g., buried rock, logs, clay tiles, or pipes) which are designed to lower the water table. Ditches, dikes, and gullies are more evident as they can appear on the surface. Often ditches will look too straight to be natural or may run along the toe of a slope in an effort to divert runoff from reaching a downstream valley.
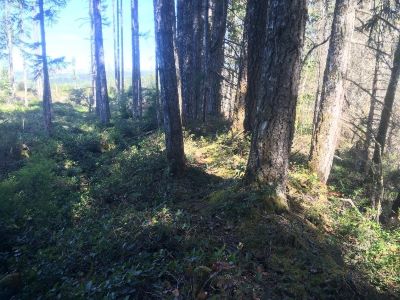
Photo: An old rail grade, now covered in trees, which continues to modify the hydrology of a wetland upstream of it.
Outlet Condition
It’s important to take a close look at any outlets of your wetland (i.e., where water flows out of the wetland). Look for evidence of downcutting or erosion at the outlet. Generally, a wetland outlet that has a wide floodplain or outflow will help to reduce sheer stress on the soils below and reduce potential for downcutting whereas a narrow channel concentrates the shear-stress.
A wetland that has a hardened outlet that has deep root masses or is armoured with rock or bedrock will protect the outlet from erosion. If a beaver dam is located at the outlet of your wetland, then look to see if there is still beaver activity (e.g., freshly cut logs). If the beaver dam is breached and there is no recent sign of beaver to maintain the dam, then your wetland may be at risk.
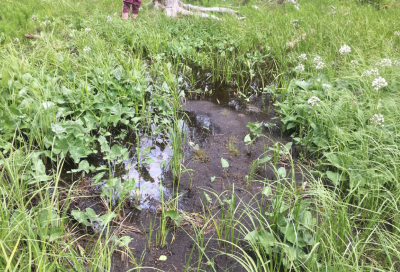
Photo: Sediment deposition downstream from a beaver dam, plus no recent sign of beaver in the wetland, indicates this outlet is no longer considered stable.
Structural Alteration of Streambank or Wetland Shoreline
Compromised shorelines cannot provide proper wetland function such as fish cover, habitat for aquatic invertebrates/amphibians, erosion control, or support other natural processes. You will estimate the percent of the shoreline’s perimeter (interface of open water and vegetation communities) that has any alteration such as physical structures, livestock compaction, and vegetation removal.
Signs of Excessive Nutrient Loading such as: Algae mats, Blooms or Fish kills
Algae mats/blooms or fish kills signify poor water quality and are often associated with changes in temperature, pH and nutrients. Document any abnormalities. Refer to the Wetlands of BC: A guide to classification to determine the natural range of pH for specific wetland plant associations. A wetland that has lost its canopy cover may have an increase in water temperature.
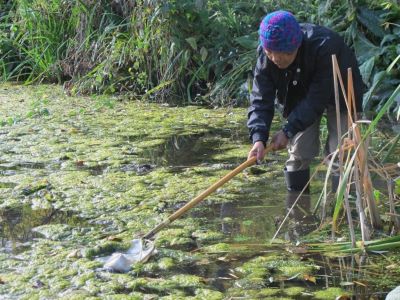
Photo: Excessive algae blooms clearly indicate excessive nutrient loading to this site from upstream inputs.
LESSON 7: Self Check Questions
True or False:
- We may expect to see browsing on Cornus stolonifera (red-osier dogwood).
- Dead trees around the perimeter of the wetland indicates a potential change in hydrology.
Answers
- True – Cornus stolonifera is a palatable shrub species.
- True – Dead trees around the perimeter often indicate an increased and prolonged hydroperiod.