
Lesson 4- Pre-field Desktop Information
![]()
Learning Objectives
This lesson covers how to collect information about your target wetland prior to heading out into the field once you are ready to sample on your own (information on the selected sample wetlands for field training will be provided). Gathering this data will improve your ability to (1) identify any discrepancies between available wetland spatial files previously delineated and recent satellite imagery, (2) answer questions regarding the landscape condition, (3) prepare maps or notes for interpretation in the field; and (4) possibly identify stressors you’ll want to further investigate once in the field.
Users should be somewhat familiar with navigating various online mapping tools and setting up basic spatial queries. See the companion documents: Protocol to Evaluate the Health of Wetlands (Fletcher et al., 2020; hereafter referred to as “the Protocol”) and the FREP wetlands technical guidance document for more detail on all of the office-based data to be collected along with step by step direction (Available: Forest & Range Evaluation Program Fish/Riparian Monitoring - Province of British Columbia (gov.bc.ca).
Wetland Basic Information
Wetland ID: You will record the wetland ID so that others who review your file can find the same wetland you’ve sampled and can look at the polygon information that informed your interpretation. There could be different sources where your documented wetland may come from.
Bio-geoclimatic Classification: The bio-geoclimatic classification is documented to help you classify your wetland plant association, determine your wetland riparian class (W1 to W5) and associated riparian management zones, and identify a target for the amount of mature and old growth forest within 2 kilometers. Review the WMREE technical guidance document for step by step instructions on how to obtain this information from iMapBC.
Natural Disturbance Type: Natural Disturbance Types are broad categories that describe how frequently forest stands are naturally regenerated due to disturbances such as fires. The Natural Disturbance Type is documented to determine the target mature and old-growth forest within 2 km of your wetland. Natural Disturbance Type can also be found on iMapBC.
Hydrogeomorphic System: You will identify the hydrogeomorphic position that best explains how water occupies the site based on its position on the landscape.
Marine systems are affected by tides and occur along the coast.
Estuarine systems are at the confluence of freshwater fluvial and marine environments.
Fluvial systems are associated with freshwater streams and or rivers that are influenced by flood events and can be affected by erosion, deposition, and sedimentation processes.
Lacustrine wetlands are associated with large freshwater bodies (e.g., lakes); they can also be affected by sedimentation, flooding, and wave action.
Palustrine systems are not influenced by lakes or fluvial processes, and there are a few subcategories: Basins & Hollows; Ponds & Potholes; and Seepage Slopes. Basins & Hollows occur in topographical low points, with water near or at the surface; they receive water primarily from groundwater and rainwater. Ponds & Potholes are typically next to small waterbodies. Seepage slopes occur on sloped terrain where groundwater is near or at the surface.
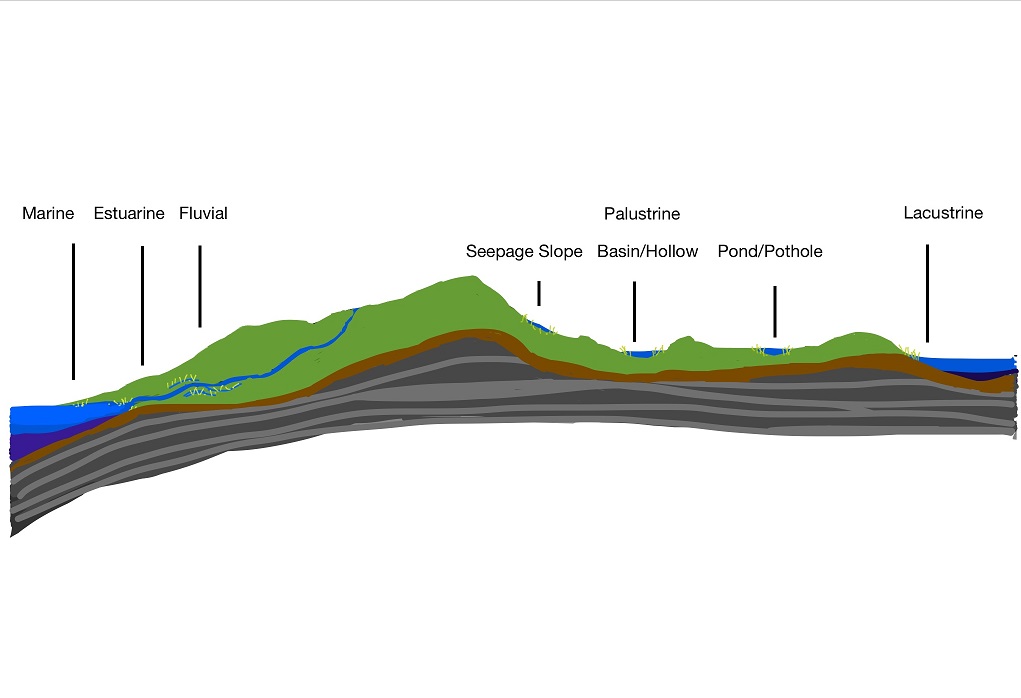
Figure: Examples of hydrogeomorphic system types.
First Nations Information
First Nations are also often interested in activities occurring within their traditional territory, including assessing the health of wetlands. Many First Nations communities have close relationships to wetlands spiritually, culturally, and for utilization such as harvesting of fish, wildlife, and plants. It’s important to involve local First Nations in the assessment process and ensure they have an opportunity to participate. To determine which First Nation(s) should be contacted, use the mapping tool at: http://maps.gov.bc.ca/ess/hm/cadb/. Step by step instructions on how to do this can be found in the FREP wetlands technical guidance document.
Wetland Size and Forestry Classification
You will calculate the wetland size in square meters. If you are satisfied with a layer that is already digitized, such as the Fresh Water Atlas wetlands layer, then you can generally find the area within the attribute data of that layer (visible within iMapBC). However, wetlands are notoriously poorly mapped in BC, so it is best to compare any spatial linework with imagery and/or the Site Plan developed by the forest company. If you suspect that the wetland polygon depicted in existing spatial layers is not accurate, then you will need to digitize the boundaries of your wetland. For FREPmap users (government only), you can measure the size of your wetland by using the draw tool.
The assessment polygon will include a 10m riparian buffer around the wetland and this can also be drawn and calculated using ArcMap or FREPmap tools. The total polygon assessed will be: Total Polygon assessed (m2)= [Wetland assessed + 10 m upland riparian buffer].
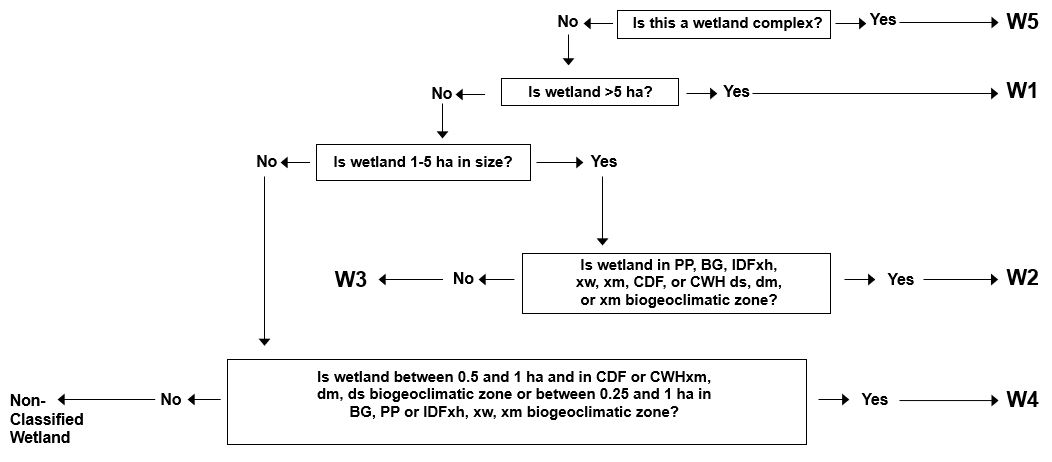
Wetland Riparian Class: Riparian classes are based on wetland size and biogeoclimatic zone. Note: A wetland complex (W5) must consist of two or more individual wetlands with overlapping riparian management areas and a combined wetland area of 5 ha or more. Use the key below to help identify which wetland riparian class the wetland that is being assessed falls into.
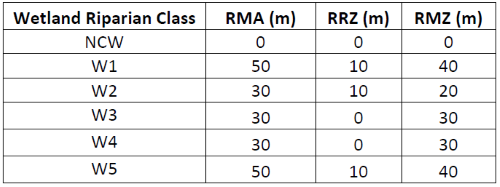
Riparian Management Area (RMA): The RMA is the forested area next to a riparian area or wetland where riparian management applies with respect to specific logging prescriptions. The RMA is determined by the Riparian Classification and includes the Riparian Management Zone (RMZ), and Riparian Reserve Zone (RRZ).
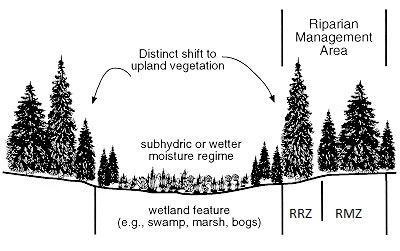
Riparian Reserve Zone (RRZ) : The RRZ is located within the RMA and makes up part of the RMA area. No forestry operations will take place in the RRZ. The width of the RRZ will depend on the Wetland Riparian Classification.
Riparian Management Zone (RMZ): The RMZ is located within the RMA, and where prescribed harvesting and forestry activities may still take place. Generally, a lighter footprint of disturbance is anticipated within this area in comparison to the rest of the cutblock. Various management techniques can help to lighten the footprint, such as partial harvesting, retention of non-merchantable timber and other canopy layers, and feathering/stubbing of merchantable wood to reduce windthrow to the RRZ or forested wetland.
Length of Wetland Perimeter within Assessment Polygon
The length of perimeter around the wetland is important to determine for the field data calculations and can be measured using ArcMap or FREPmap while in the office. You will only consider the perimeter that is within the assessment polygon. Generally, this will include the entire wetland perimeter, unless there is a rationale to constrain the assessment to a smaller area.
Dominant Upland Vegetation Strata
The structure and condition of the surrounding area that abuts a wetland can influence the health of the wetland. A stratification process helps determine where sample transects will be placed in the field. When reviewing maps and remote imagery, you will stratify the surrounding area that abuts your wetland into a few distinct zones with each stratum covering no less than 10% of a perimeter edge. If completing a FREP assessment, ensure the recent cut block is represented by at least one of the strata. In wetlands < 5 hectares, limit this process to 3 major strata where you will place transects. Once strata are defined along the perimeter of the wetland, you will randomly select a position along the perimeter within each that will mark your transect locations.
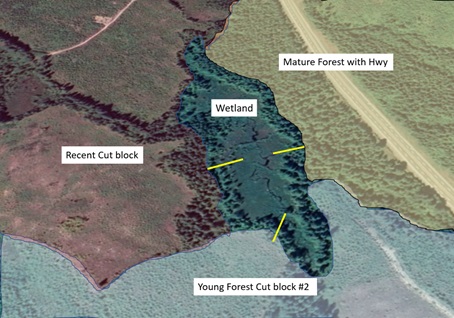
Figure: Delineation of upland strata
You will record the length of the wetland perimeter occupied by the strata, then calculate the fraction that each segment represents. These proportions are used to weight the field data that is collected. For example, if your total perimeter is 800m and the cutblock segment is along 200m, then the fraction is 0.25 (or 25%). The combined fractions of all strata should sum to 1.
On occasion there will be fewer than 3 strata present abutting the perimeter of the wetland (e.g., the wetland is entirely surrounded by the cutblock). If there is only one stratum, you will place up to 3 transects into that stratum. If there are 2 strata, place 2 transects into the stratum that has the greatest fraction.
Delineating a Wetland’s Contributing Basin
Human development is considered within the contributing basin upslope of your sample wetland. The contributing basin can generally be interpreted with a stream layer and an elevational contour line layer. First, observe all the streams that are connected and flow through your wetland. If the streams are flowing away from your wetland, then these are outside of the contributing basin. Distinguishing between the headwater areas of streams passing or not passing your wetland, will give you a coarse approximation of where the boundaries of the contributing basin exist.
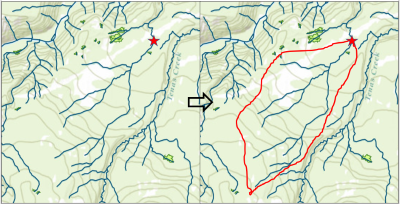
Figure: Delineation of a contributing basin.
Using an area-based measurement tool (in ArcGIS, iMapBC or FREPmap), you will calculate the amount of the contributing area that has evidence of human development as a percent of the total contributing area. You may be able to determine this best by reviewing satellite imagery, in combination with layers such as roads and cut blocks. You will be asked to identify the main upstream development type (roads, transportation other than roads, forestry, agriculture, recreation, mining, oil and gas, or utility lines).
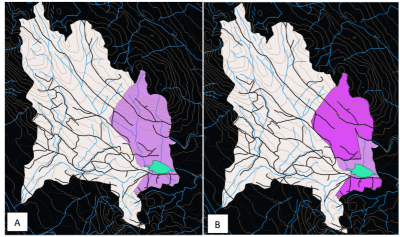
Contributing basin intercepted by roads and ROWs: You will estimate the percentage of your wetland’s contributing basin that is intercepted by roads by reviewing the area of land where surface water would need to pass across a road before it reaches the wetland. In the figure below, the contributing basin is shown as light pink (A) and the area of contributing basin with surface water flow requiring to pass across/through a road is shown as dark pink (B).
Road Crossings
Roads are one of the most common disturbances that can disrupt drainage patterns affecting a wetland’s inflow or outflow. Undersized, blocked, or poorly positioned culverts may lead to disruptions in surface water flows.
You will identify and record the number of road crossings within and upslope of the assessment polygon, including all upstream tributaries that eventually flow into the assessment polygon. Remember that the assessment polygon includes the wetland area plus a buffer of 10m that abuts the wetland perimeter.
You will also determine whether the mapped streams at roads within the contributing basins are within their original water courses. Any uncertain office-based conclusions on this can be confirmed in the field when approaching or leaving the wetland. Inspect the sides of the road for water movement that may divert flow away from the natural downstream receiving waters.
Visible Shoreline
Visual screening is important for wildlife species such as moose and waterfowl. A wetland that lacks visual screening exposes potential prey to hunters and other predators. It can also increase overall disturbance to wildlife which can affect energy reserves if animals are forced to escape or find better cover. This indicator is best confirmed in the field from various vantage points along roads or right of ways (ROW). However, you can plan your field work by selecting possible vantage points from reviewing satellite imagery. Look for possible roads or ROW within 300 m (for wetlands <5 ha) or 500 m (for wetlands > 5ha). Consider the topography of the site as higher ground will provide better vantage points. You will calculate the maximum percentage of the wetland “shoreline” that is exposed from a human-made linear feature.
Right-of-ways within 100m of Wetland Perimeter
Right-of-ways can provide easy access to predators (both human and other animals) and increase overall disturbance to a site. Roads and other ROW may also disrupt surface or sub-surface flows which may affect the wetlands hydrology. You will create a 100m geospatial buffer around your wetland perimeter using Arc Map or FREPmap tools and determine the % of the perimeter that has roads impinging within 100m. In the figure below, 160 m of the total 340 m wetland perimeter has a road within 100m. Thus 47% of the wetland perimeter had road within 100 m.
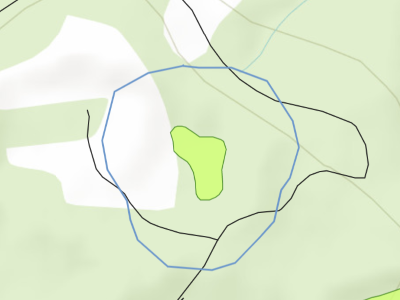
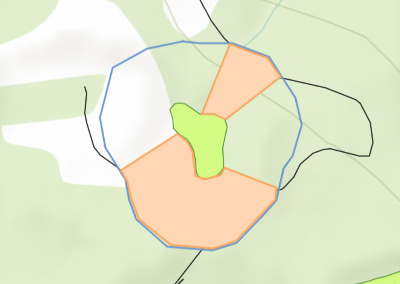
Figure: To better visualize the amount of the buffer that is impinged by ROWs, it may help to draw a polygon that runs perpendicular from the wetland edge to the 100m buffer at the point of road intersection.
LESSON 4: Self-Check Questions
True or False:
- The Fresh Water Atlas wetland layer is a reliable source for spatial information regarding your wetland – especially the boundaries of your wetland
- In the protocol, transects are placed equidistance apart around the perimeter
Answers
- False – although a helpful tool, most of the wetlands in the FWA were interpreted solely from older airphoto interpretation. Many wetlands are missing, and the boundaries are often not accurate. Site plans, recent imagery and other data sources, including your own observations should also be used to confirm wetland location and perimeter.
- False – transects are placed randomly within strata that you assign. These strata are separated based on major differences in the vegetation and disturbance history that abuts the perimeter of the wetland.