
Lesson 6- Transect & Continuous Indicators
![]()
Learning Objectives
This lesson covers the basic indicator data which are collected along the transect within both the wetland and 10 m upland during the field assessment. Some indicators require careful measurement as you progress along the transects, while others (continuous indicators) are best recorded after you have looked at the entire wetland sample area.
In this lesson, you will learn:
- Continuous Indicators to watch for while examining transects;
- How to identify and measure attributes as you walk the transect; and
- Where to record the information you collect, and how to use it to answer the evaluation questions.
Vegetation Cover
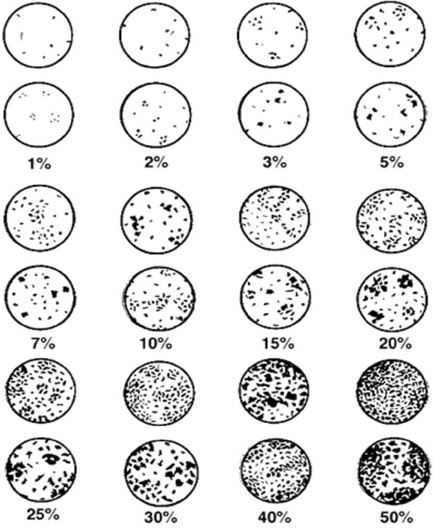
A healthy establishment of vegetation supports many functions, such as filtering pollutants, cycling carbon and nutrients, and providing habitat to fish and wildlife. You will estimate percent cover by species at each plot within your transect (10m on either side of the transect and up to 10m in front and behind you within that vegetation zone) by assessing what percent of the ground is covered by that species when looking from a bird’s eye view. You will also estimate percent cover in general for the entire transect swath. An example of different cover estimates is given in the figure below. You will include all rooted plant material (live or dead), but not the area covered by water, fallen wood or other plant litter.
While estimating vegetative cover by species, you will record form, vigor and recruitment for each species observation. Poor vegetative form may include atypical plant structure or physical damage, e.g., mechanical damage to trees along the edge of a cutblock or over-browsing of sedge hummocks. Poor vigor would include atypical colour (e.g., browning or yellowing), stunted growth, or disease. Poor recruitment includes lack of younger age classes.
You will include any invasive or disturbance-increaser plant species in your vegetation estimates. Invasive plants can quickly out-compete native plants within the wetland and decrease biodiversity and thus decrease suitability of wildlife habitat. Shallow-rooted invasive plants can contribute to wetland edge instability and increased erosion, decreasing the water quality and functionality of the wetland. Invasive species often have no natural predators or competitors to control them. Disturbance/Increaser species are adapted to living and thriving (increasing) in an environment that has been disturbed or is subjected to continual disturbance or stress, such as intense grazing, or erosion. These undesirable species will often perform poorly, have shallow roots and are less productive than other plants.
Culturally significant plants will be identified as such during the vegetation estimates. These are important to indigenous peoples in BC, such as for medicinal or ceremonial purposes. Many wetland plants have some use to First Nations. Lists of invasive, disturbance and culturally significant species are found in the Protocol appendices. You could also consult your local First Nations to determine if there are specific plants they consider a priority to monitor.
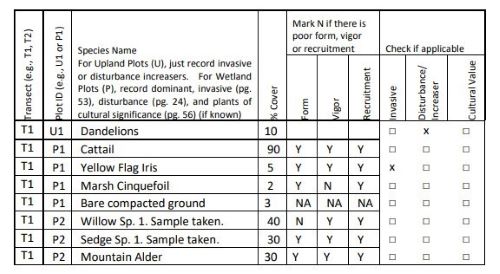
The dominant native wetland plants within the wetland can help to determine the wetland plant association. See figure below for an example of a completed vegetation table. Note that only invasive species are identified in the upland portion of the transect, while the wetland also includes native species.
Density of Invasive Plant Species
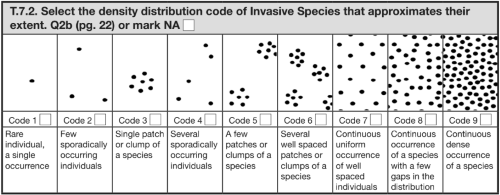
This is a continuous Indicator that should be evaluated as you are collecting information along each wetland transect. You will have already collected percent cover for invasive plant species in a previous table. You will use that information and further observations to estimate the density distribution of invasive species present. It’s possible that an invasive species may be widespread in one vegetation zone (e.g., a marsh zone), but not another. The density distribution selected should be the highest observed in any one vegetation zone. For example, if an invasive species dominates the entire marsh zone of the wetland, then you will record it as a density distribution of 9, even if it is not found in an adjacent zone.
Live Woody Vegetation Removal in the Wetland
Live woody plants provide important structure and is a recruit for CWD and snags that are utilized by wildlife. Using field observation, you will record any live woody vegetation removal in the wetland portion of the transects (the upland portion is evaluated separately). Include all causes of live wood removal such as insect outbreaks, fire, or logging - except for impacts from browsing, which is captured in a separate question. Do not consider the loss of woody species that are purposely removed because they are non-native and invasive.
Bare and compacted ground
You will estimate the % of bare and/or compacted ground within the assessment area, both within the wetland and 10 m abutting the wetland. Bare ground means there is no vegetation. This is problematic as it can serve as a sediment source to receiving waters, and it is no longer providing functions associated with growing vegetation. Sources of bare ground can include heavily grazed sites, tipped tree roots, areas of mass erosion and disturbance from machinery.
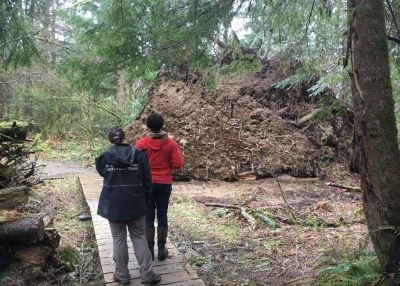
Photo: Upturned rootwad showing exposed soil that may be transferred to a wetland.
Compacted soils may also be bare ground, or if there is vegetation it may only be shallowly rooted. This will mean the soils are limited in their ability to allow for water percolation or to resist erosion. Sources of compacted ground can include cattle pugging, fill, roads, and trails. You will consider both bare and compacted ground in your estimate and consider the entire swath of your transect when answering this question.
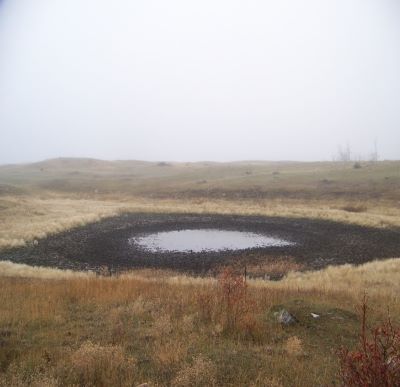
Photo: Exposed soil and compaction resulting from cattle.
Dead and Decadent Trees
Using field observations and/or aerial photography you will record the % of dead or decadent trees in comparison to live and healthy trees. In this situation, decadent refers to a tree that is marked by decay or decline, with more than 30% of its canopy unvegetated. The total percentage recorded is a fraction of the canopy cover, not a fraction of the total polygon.
We are looking for trees affected due to impact or disease, climatic, or hydrological stresses (e.g., too much or too little water). You will not include trees that are naturally dying, such as early seral species unless you can determine that they are rapidly dying or decadent due to a stressor.
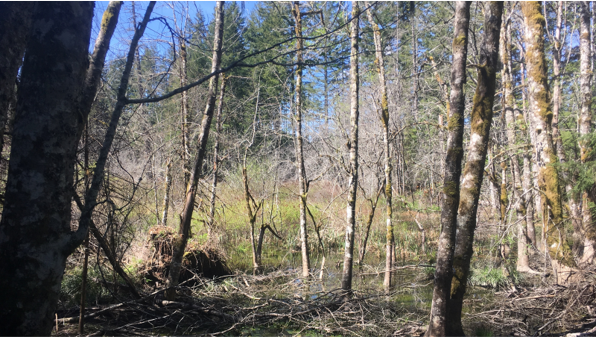
Photo: Dead trees as a result of fluctuating water levels.
Coarse Woody Debris
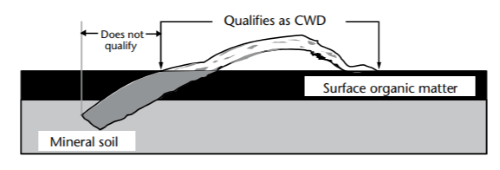
Coarse woody debris (CWD) supports a number of functions such as habitat for invertebrates, small mammals and amphibians, healthy soil formation processes, microtopography to support a diversity of vegetation, etc. However, too much or too little is problematic. Here, CWD is defined as dead woody material located above the soil, larger than 7.5 cm in diameter which is not self-supporting located at the transect crossing point. Trees and stumps (intact in ground) are considered self-supporting, therefore not CWD. The observation of CWD is only recorded for those pieces that intersect your transect rotary tape.
With this indicator we are interested in excess CWD from recent disturbances. While walking your entire transect line, you’ll document each piece of coarse woody debris that intersects the tape and document if it is New (N) or Old (O). As part of the health assessment you’ll also be determining if there is a diversity of diameter and decay classes, so it’s helpful to make these observations while you are assessing CWD.
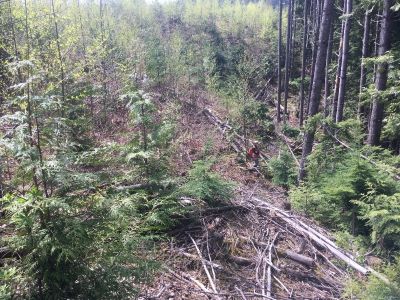
Photo: Excessive CWD around the perimeter of a wetland.
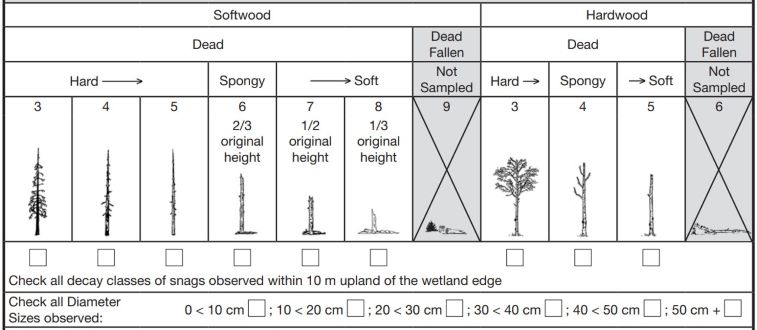
Snags and Coarse Woody Debris Classifications
While measuring CWD, you will check off decay and diameter classes found in the field tables, along with observations on any snags observed within the entire transect swath. Decay classes are based on wood type and physical form. Once you’ve checked off a decay class or diameter range, you don’t need to check off the same class or diameter range again as this is a continuous observation.
Decay classes: The decay classes for snags and CWD vary. Snag decay classes are differentiated by softwood and hardwood, as these types of trees decay at different paces. If the snag still has branches on it and is at its original height, it is less decayed than a snag that has no branches, loose bark, and is only standing at a portion of its original height.
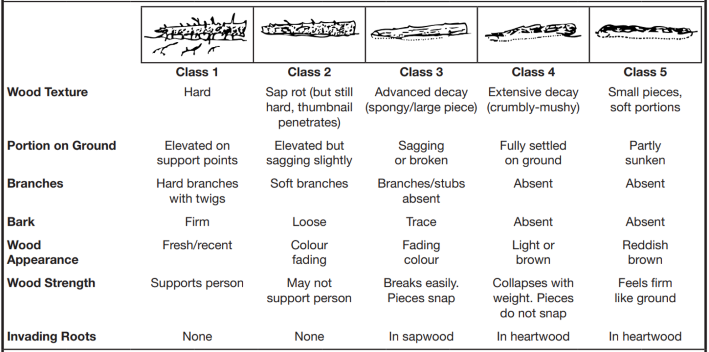
Coarse woody debris is assigned a decay class based on the main condition of each piece encountered along the transect. The five classes used to describe the condition of CWD are based primarily upon wood texture, and secondarily on other characteristics. CWD decay is due to respiration, biological transformation, leaching, fragmentation, and weathering.
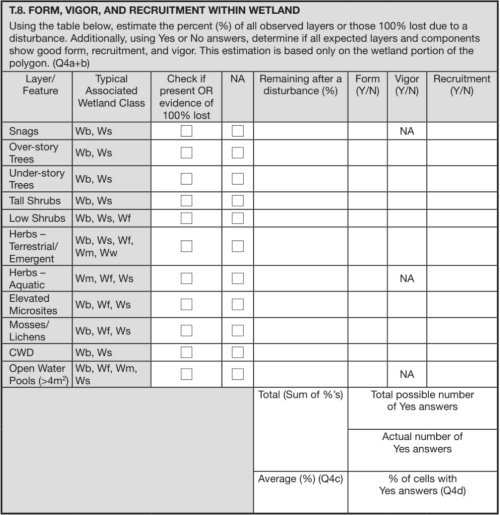
Structural Composition/Vegetation Layers
Here we are assessing the extent and quality of vegetation layers. Layers to consider include snags, over-story trees, understory trees, tall shrubs, low shrubs, herbs, elevated microsites, mosses/lichens, CWD, and open water pools. This is a continuous indicator, meaning that it is estimated after completing the transects and walking around the assessment polygon, but be aware that separate tables are filled out for the wetland vs the upland portion of the assessment area. Observations are not limited to the transects; however, transect information can aid in the estimations.
Not all layers will be naturally present (ie. there is no tree layer in a fen), so you will only be evaluating those that are present or were present but were removed. You will record the amount that remains post-disturbance and include observations on their form, vigor, and recruitment. In terms of recruitment, the presence of one layer may indicate the recruitment of another layer. For instance, the presence of understory trees signifies that overstory trees have good recruitment. In turn, the presence of overstory trees signifies good recruitment for snags, CWD, and canopy gaps.
Wildlife Trees
During the walk along each transect, assessors will evaluate any wildlife trees. Wildlife trees are one of the most valuable components of stand-level biodiversity. There are more than 80 tree-dependent wildlife species in British Columbia, with the largest group consisting of cavity-nesting birds, such as owls, woodpeckers, and some ducks. Wildlife trees are any standing dead or live tree with special characteristics that provide habitat for wildlife. While walking along the transect, you will make sure to record any observations of wildlife trees that were damaged during the treatment (e.g. logging).
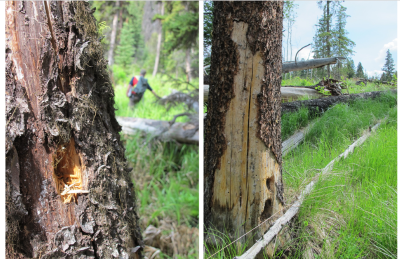
Figure: Two examples of wildlife trees.
Some signs of wildlife use include cavities in trees, loose bark (suitable for a bat roost), nests, snags used as perches, and witches’ broom growing on the tree (provides habitat for marten and other wildlife). If you identify these but they look like they are damaged and no longer functioning properly for wildlife, record them.
Large Non-homogenous Patches
While walking around your assessment polygon, you may observe anomalies that are significant stressors located outside of the transect. These can include large patches of bare soil, invasive plants, disturbance/increaser species, harvesting in the wetland, low retention in the upland buffer, dead or decadent trees, excessive windthrow or newly deposited coarse woody debris. These will be recorded as “Large non-homogenous patches outside transect but within assessment polygon” and they may affect your overall score.
LESSON 6: Self check questions
True or False:
- When recording invasive plant density distribution, you will select the distribution relative to the entire wetland assessment polygon.
- All CWD larger than 10cm in diameter is tallied.
Answers
- False – invasive plants will likely occupy discrete vegetation zones (e.g., marsh zone). Document the spread of the distribution relative to its potential spread within a vegetation zone, not the entire polygon which can have multiple vegetation zones.
- False - CWD larger than 7.5 cm in diameter is tallied.