Viewing Analytics Dashboards
Last reviewed: October 20, 2022
Dashboards combine visual and tabular presentation of data.
CMS Lite has 5 standard dashboards and Standalone sites have at minimum 2 standard dashboards:
CMS Lite Dashboards
Standalone Site Dashboards
These dashboards are represented as tabs:
Data in the dashboards are presented as an individual “tile” or a light-coloured rectangular shaped image with the specific metric(s) results.
To switch between the dashboards, click on any of the labelled tabs.
Note: Any filter changes you make will not carry over when you switch between dashboards.
Page Dashboard
In CMS Lite, the first dashboard you'll see on the Analytics tab is the one for the page you've selected. This dashboard provides information at the page level.
Please refer to the Glossary for the definitions and definitions of the tiles/terms below.
Tiles
The standard Page Dashboard is made of the following tiles:
- Sessions
- Average Session Duration
- Page Views
- Page Views Per Session
- Traffic Summary
- Traffic Map
- Time of Day and Day of Week Heatmap
- Top Referral URLs
- Top Google.com Searches
- Top Downloaded Clicks
- Top Gov.bc.ca Link Clicks
- Top Offsite Links
Theme Dashboards
Dashboards for theme content and traffic are also available in CMS Lite. The label on each tab specifies the theme. The information provided in these dashboards will be the same for all the pages under that theme. Refer to the glossary for detailed dashboard descriptions.
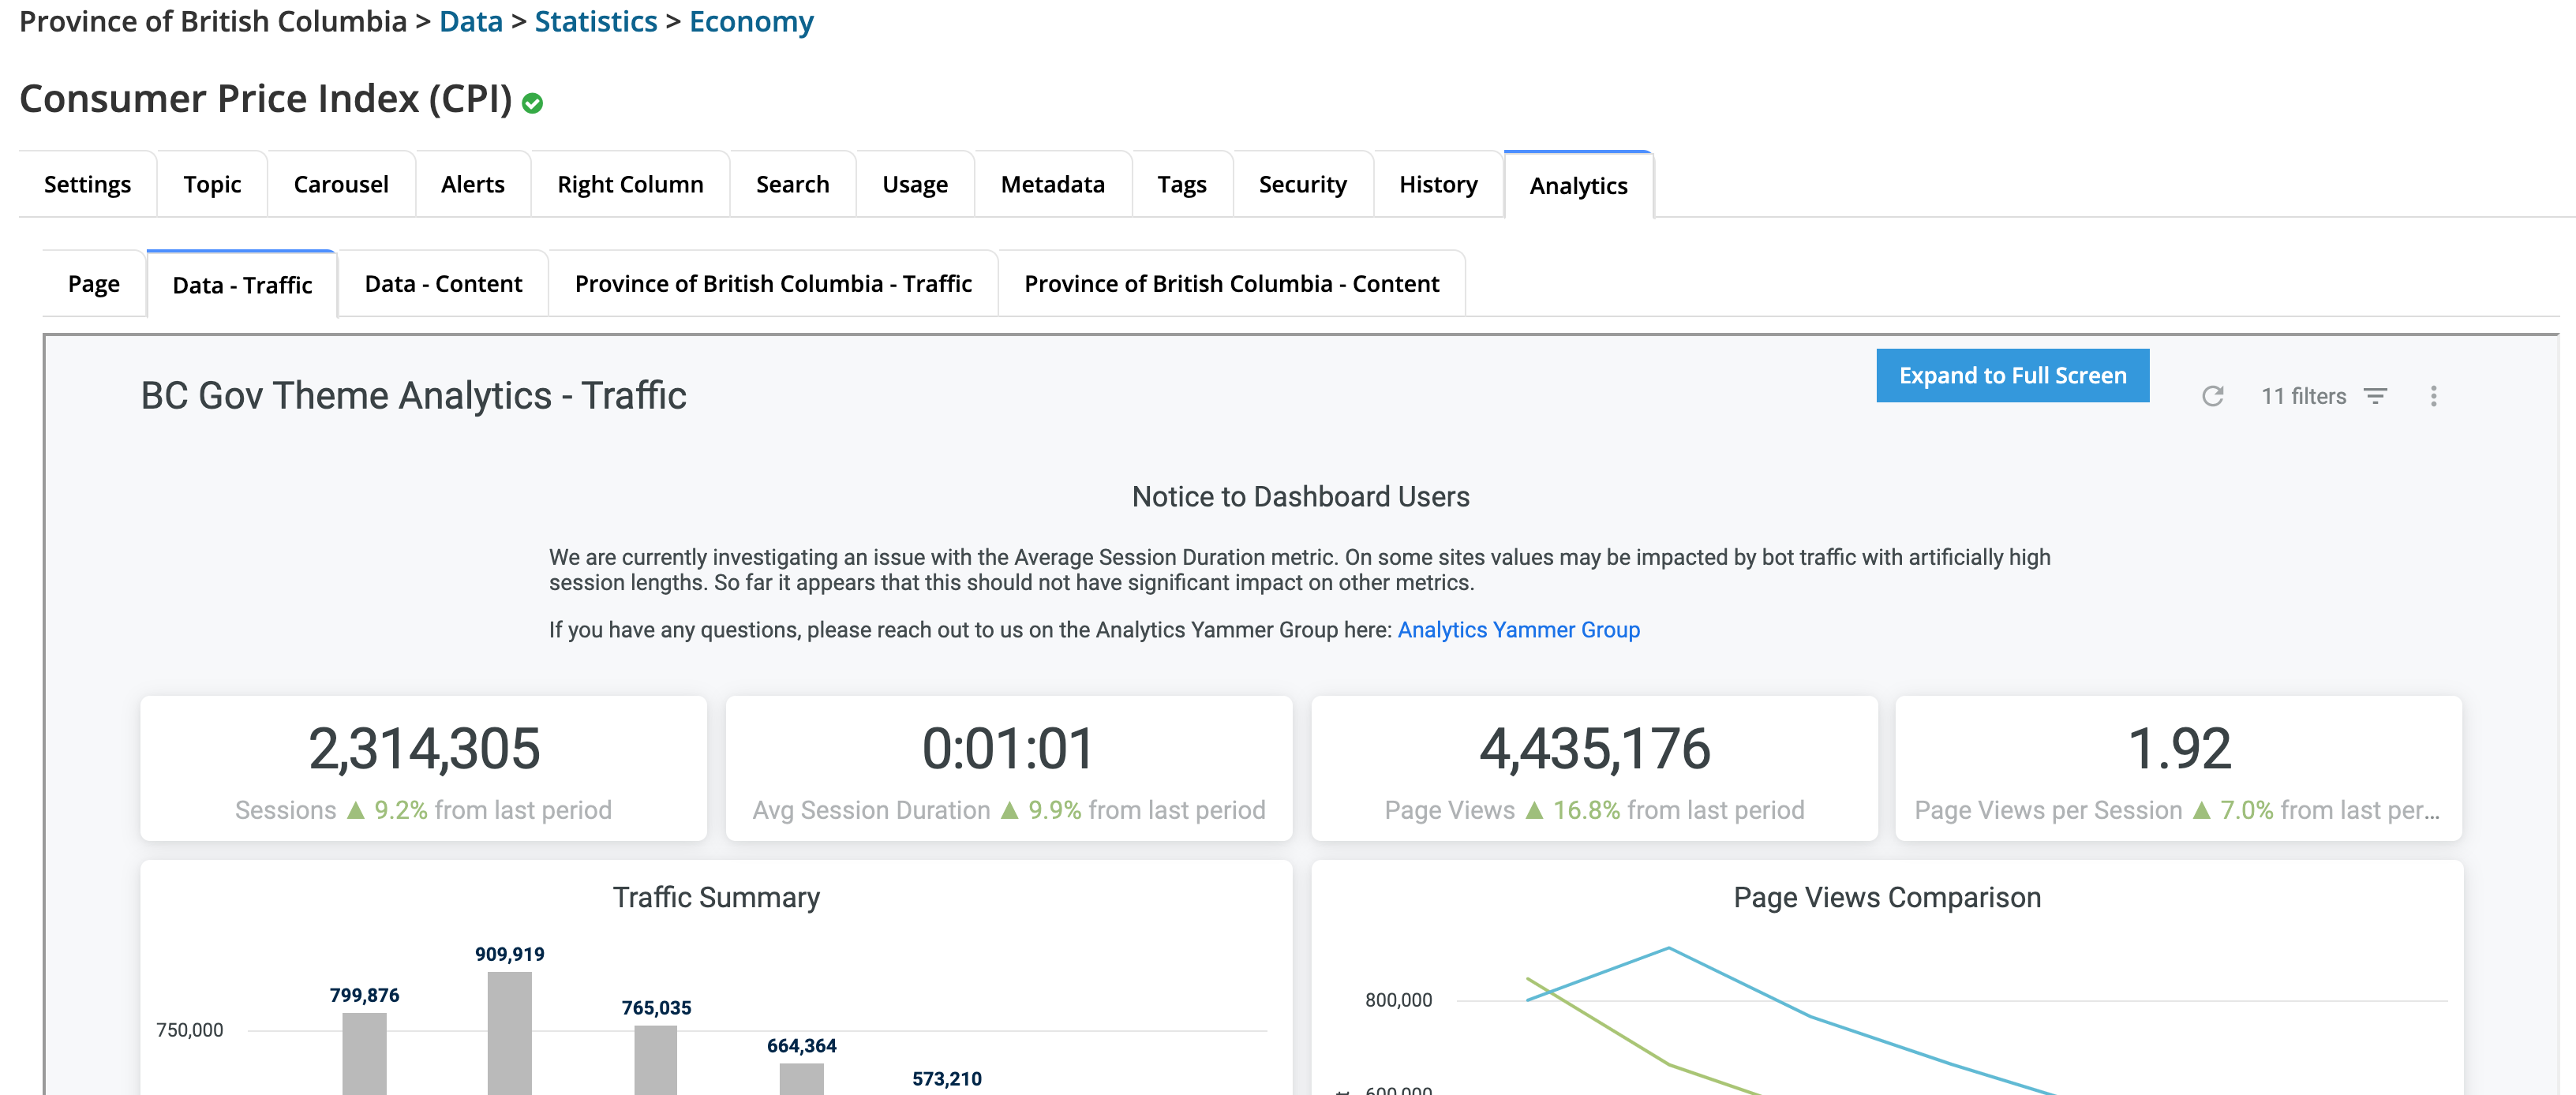
Traffic dashboard
The Theme – Traffic dashboard displays traffic results for the CMS Lite Level 1 Themes. In your dashboard, the theme shown is dependent on the page you are viewing.
Please refer to the Glossary for the definitions and definitions of the tiles/terms below.
Tiles
The standard Theme – Traffic dashboard is made of the following tiles:
- Sessions
- Average Session Duration
- Page Views
- Page Views Per Session
- Traffic Summary
- Page Views Comparison
- Time of Day and Day of Week Heatmap
- Traffic Map
- Top Platforms
- Top Browsers
- Top ISPs
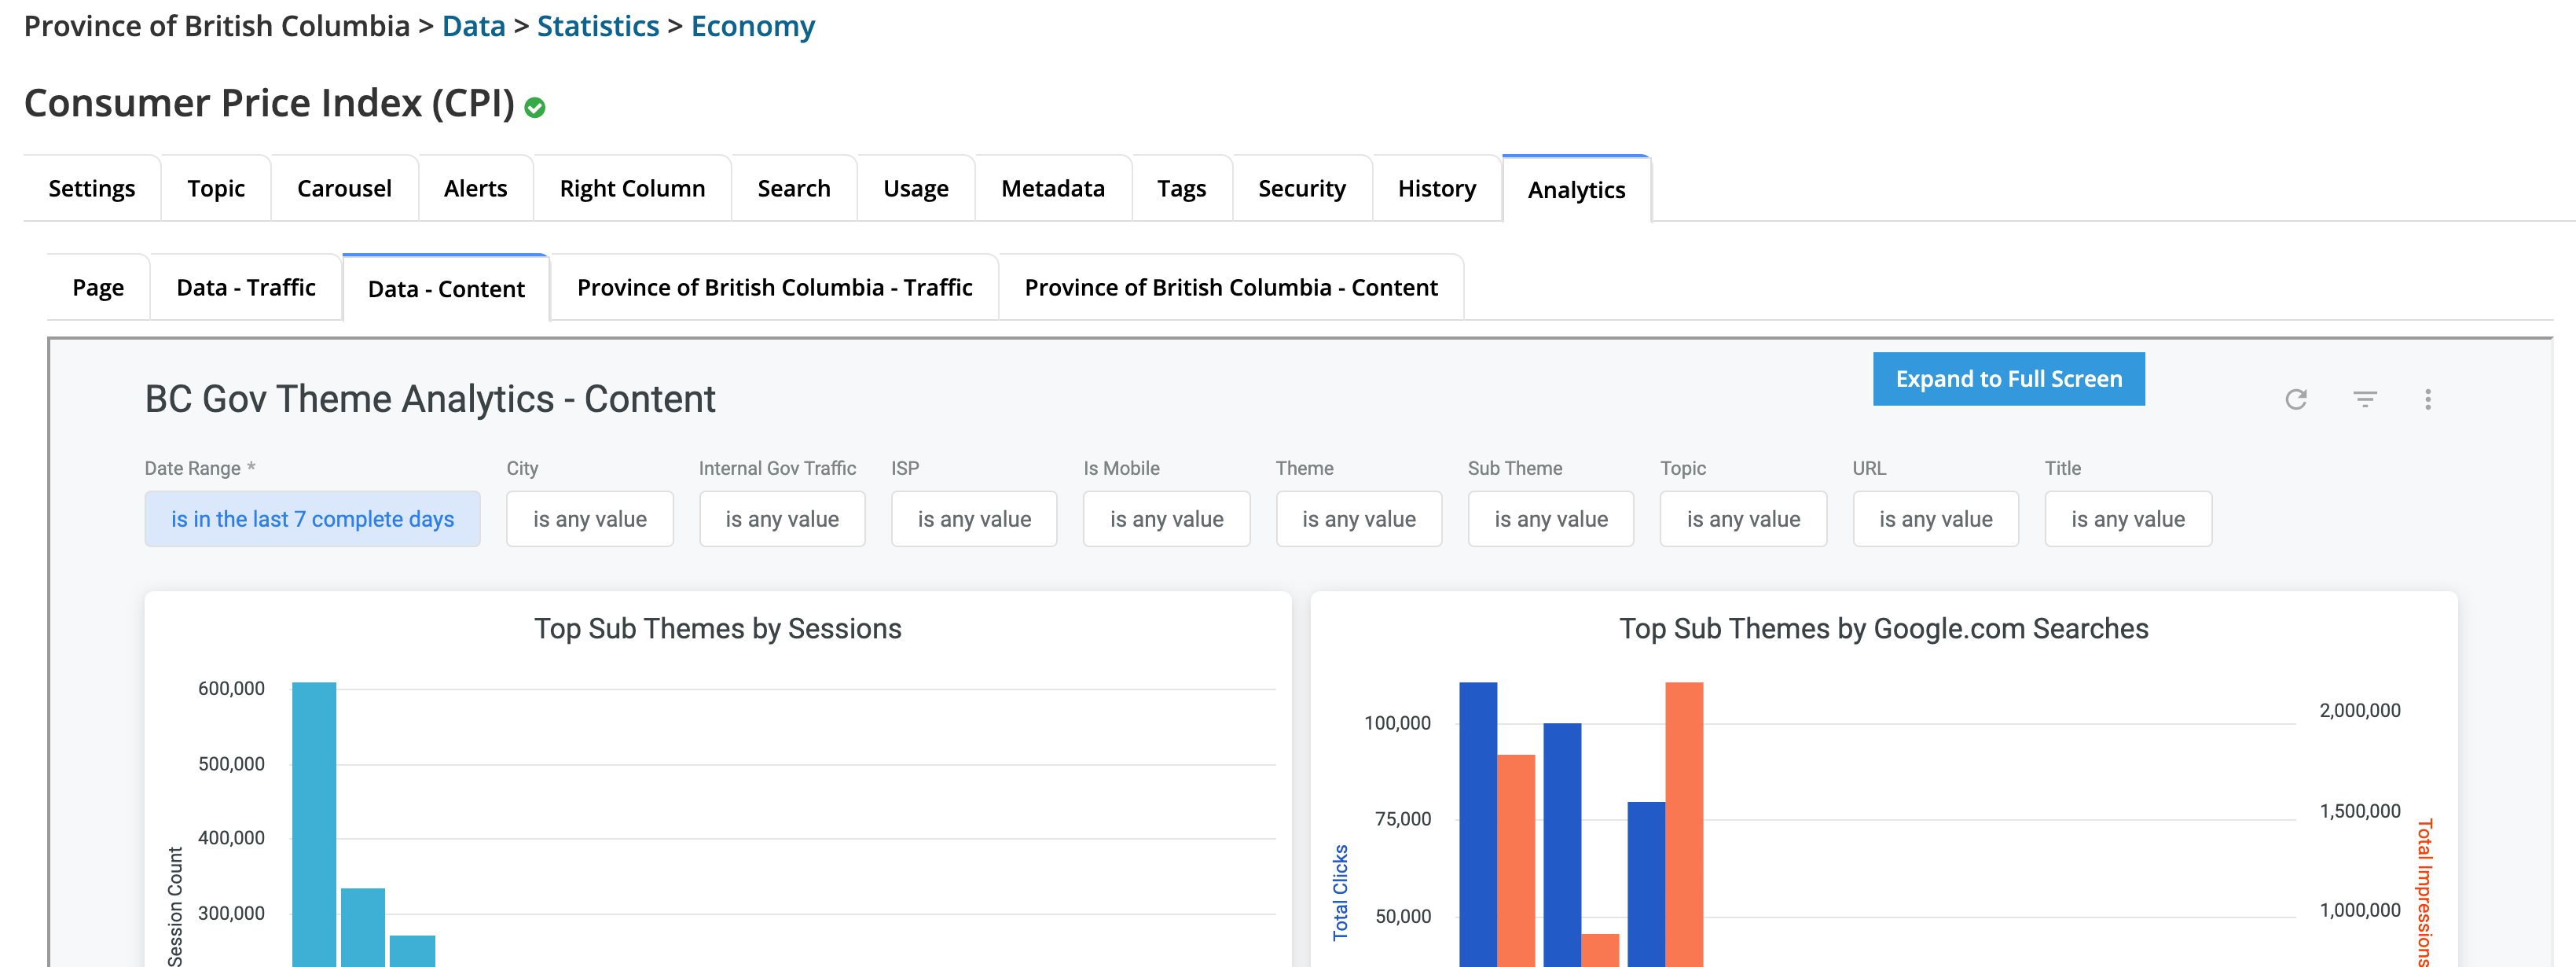
Content dashboard
The Theme - Content dashboard provides information about the pages contained in the theme or the CMS Lite Level 1 Themes. You can identify which pages visitors view most, where they came from, and what they download.
Please refer to the Glossary for the definitions and definitions of the tiles/terms below.
Tiles
The standard Theme – Content dashboard is made of the following tiles:
- Top Sub Themes by Sessions
- Top Sub Themes by Google.com Searches
- Top Landing Pages
- Page Views by Traffic Channel
- Top Pages
- Top Downloaded Clicks
- Top Gov Search Terms
- Top Offsite Links
- Top Google.com Searches
- Top Referral URLs
- Top Referrer URL Hosts
Province of British Columbia Dashboards
These dashboards provide traffic and content information at the government site level. This information is the same on all the pages within CMS Lite. Refer to the glossary for detailed dashboard descriptions.
Province of British Columbia – Traffic Dashboard
Provides traffic information at the government site level. This information is the same on all the pages within CMS Lite.
The tiles included are similar to the Theme – Traffic dashboard.
Province of British Columbia – Content Dashboard
Provides content information at the government site level. This information is the same on all the pages within CMS Lite.
The tiles included are similar to the Theme – Content dashboard.
Contact information
For information on ordering GDX Analytics services:
- Learn about GDX Analytics services (IDIR Restricted)
- Submit a request through the GDX Service Desk forms
- Email: GDX.ServiceDesk@gov.bc.ca


