
B.C.'s Outdoor Recreation Economy
 Last updated on September 21, 2026
The B.C. Outdoor Recreation Satellite Account (B.C. ORSA) is an economic model that provides a comprehensive picture of how outdoor recreation contributes to jobs, businesses, communities, and the provincial economy.
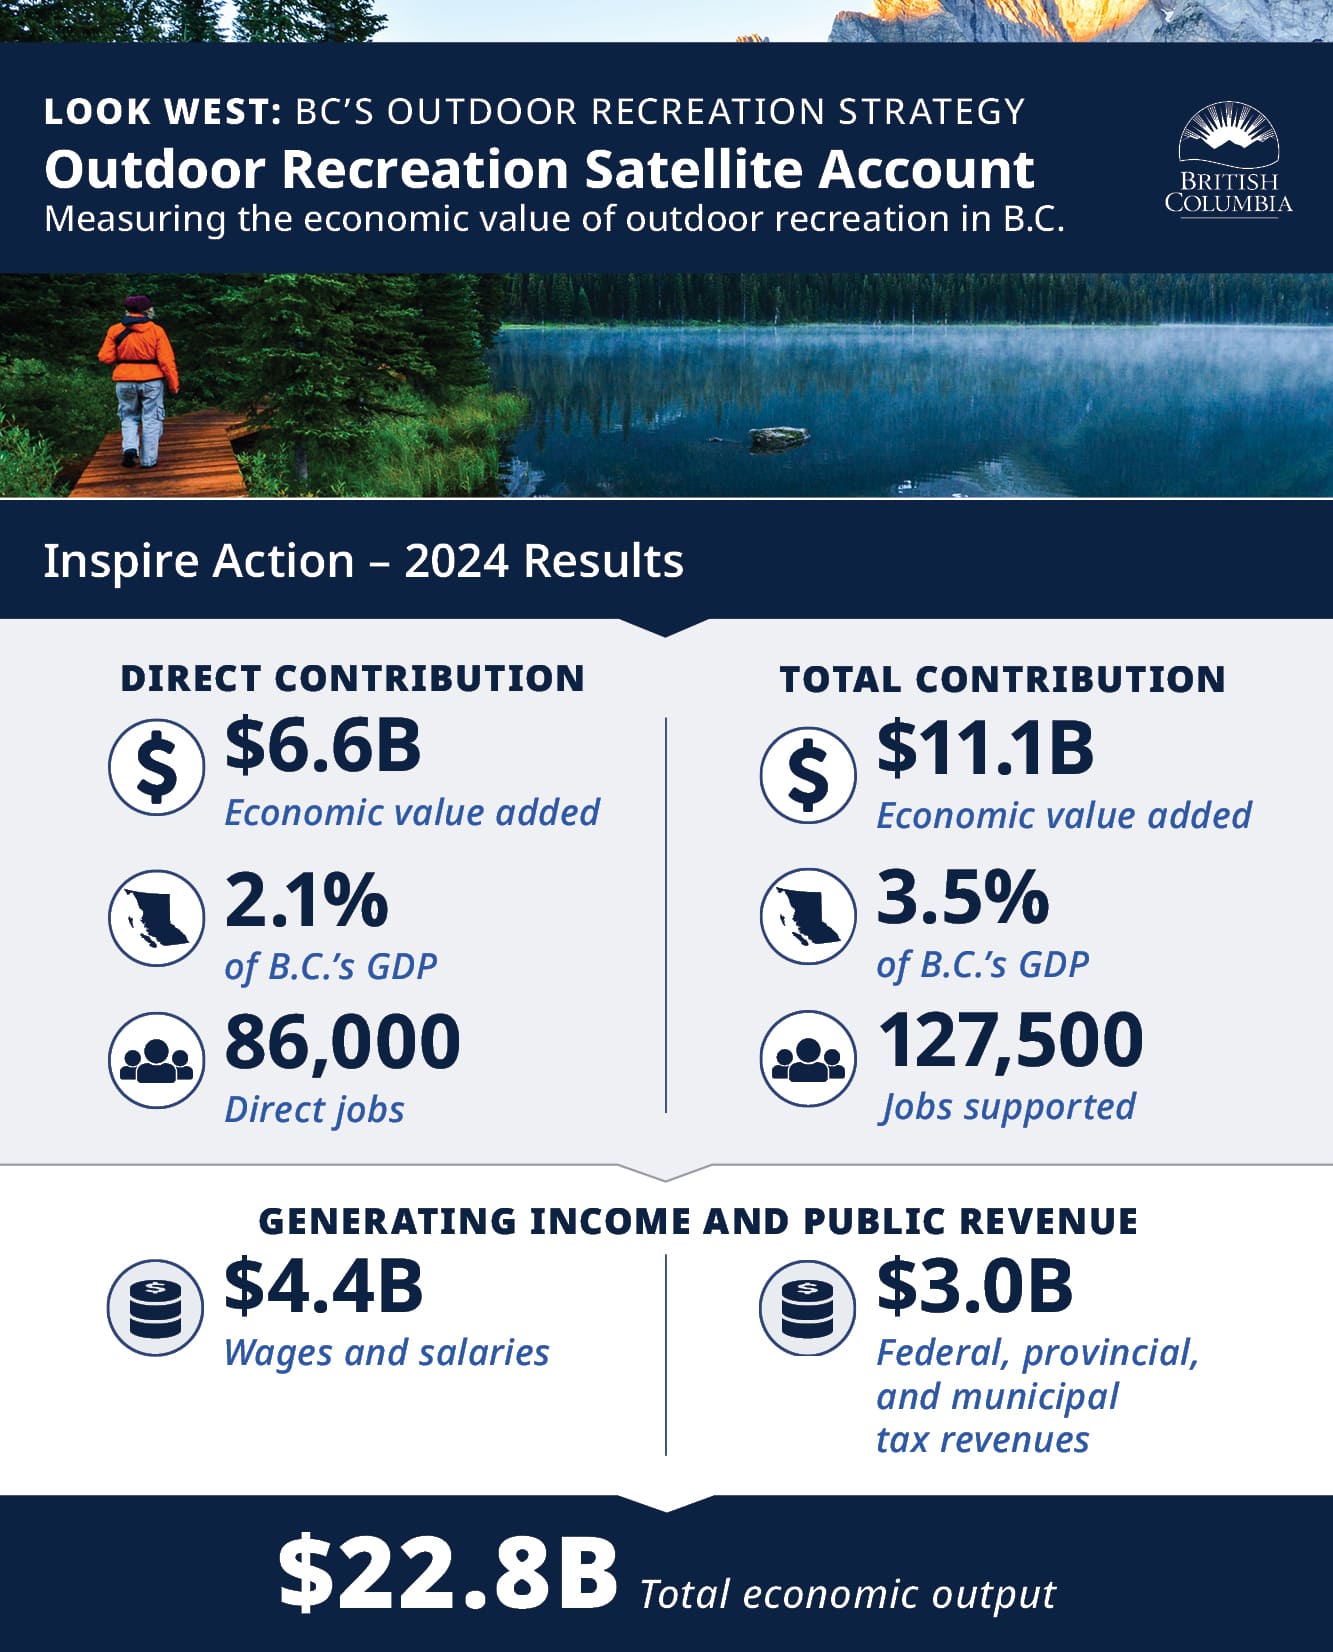
About the B.C. Outdoor Recreation Satellite Account
The B.C. Outdoor Recreation Satellite Account (B.C. ORSA) is a key initiative under the Inspire Action priority of B.C.'s Outdoor Recreation Strategy. It was created to provide a consistent way of measuring and tracking the economic contribution of outdoor recreation in British Columbia, helping build awareness of the sector's value and its role in communities across the province.
Building on previous outdoor recreation research, B.C. ORSA establishes a long-term framework that can be updated regularly and used to track change over time. The information it provides supports planning, investment, research, and policy development, while helping tell a clearer story about the importance of outdoor recreation to British Columbia.
What B.C. ORSA measures
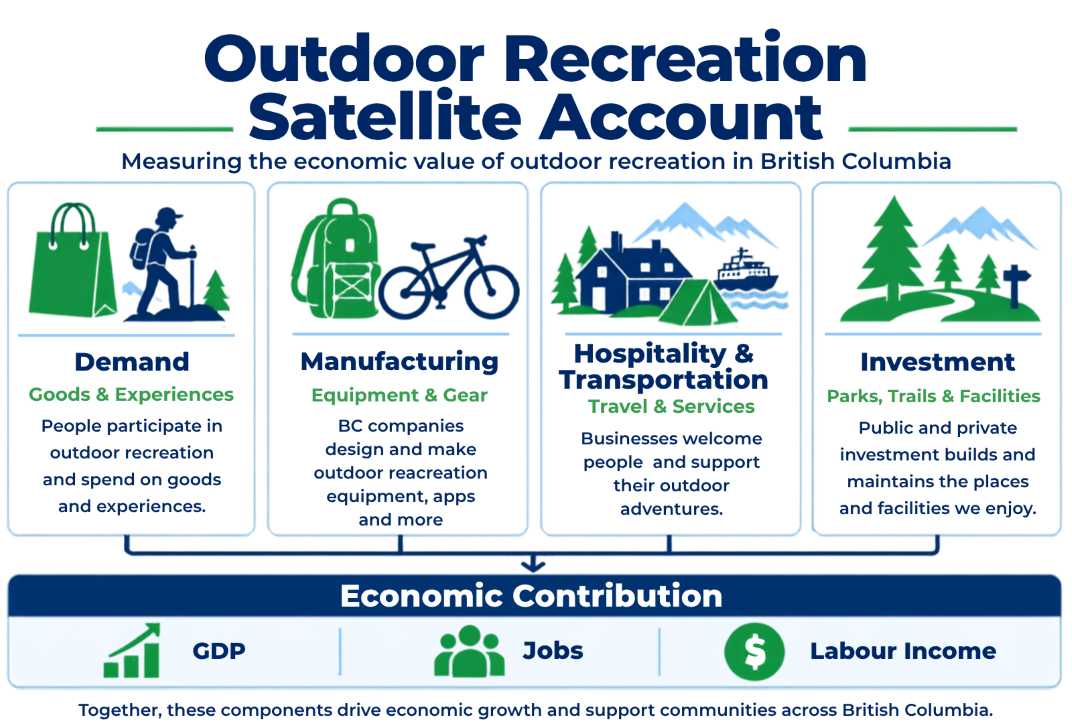
B.C. ORSA provides a detailed picture of outdoor recreation's contribution to the provincial economy through key economic indicators, including economic output, GDP, employment, labour income, and government revenues.
The account brings together information on outdoor recreation experiences, recreation-related goods and equipment, government spending, and investment activity. Using Statistics Canada data, provincial government information, economic modelling, and sector research, B.C. ORSA provides a comprehensive and reliable view of the outdoor recreation economy in British Columbia.
Looking beyond the numbers
Outdoor recreation contributes to British Columbia in ways that extend beyond economic measures. It supports healthy lifestyles, strengthens community connections, and helps make communities attractive places to live, work, and visit.
While the B.C. ORSA focuses on measuring economic activity, it also helps build a stronger understanding of the role outdoor recreation plays across the province. By providing consistent data on the size and contribution of the sector, the account can support broader conversations about growing demand for outdoor recreation and the investments needed to sustain parks, trails, infrastructure, and recreation services.
Exploring available resources
Data source
Access the B.C. ORSA raw data in XLSX or CSV formats
Learn more
What is the B.C. Outdoor Recreation Satellite Account (ORSA) dataset?
The Province of B.C. built the B.C. ORSA dataset to comprehensively measure how much outdoor recreation contributes to the economy, GDP and jobs. It isolates outdoor recreation from the broader economy and organizes it into a structure to calculate economic indicators.
Where does the data come from?
The dataset draws primarily from Statistics Canada sources, including supply and use tables, travel surveys, household spending data, and capital investment data, and is informed by interviews with select B.C. companies and organizations within the outdoor recreation sector. Finally, it incorporates relevant government administrative data, such as provincial and federal spending on parks and recreation programs.
How were these data sources chosen?
The methodology prioritizes publicly available data sources, particularly Statistics Canada, because they are standardized, regularly updated, transparent, and compatible with economic modeling frameworks such as input-output analysis. This approach ensures the dataset can be updated consistently over time and supports reliable year-over-year comparisons.
How current is the data?
The dataset primarily relies on recent available data, including 2022 supply and use tables and 2023 survey and household spending data. These values are adjusted to a common price year of 2024 using inflation factors to ensure consistency.
How often will the dataset be updated?
The dataset is designed to be updated annually. The structure of the model and its reliance on regularly released data sources allow updated data to be incorporated each year with minimal changes to the methodology.
Can this data be compared to U.S. ORSA results at the national or state level?
Both frameworks aim to measure the economic contribution of outdoor recreation using national accounting principles. The B.C. model is built using Canadian data sources and the BC Stats Input-Output Model, while the U.S. ORSA is based on U.S. national accounts, methodologies developed by the Bureau of Economic Analysis and proprietary industry data.
Can the BC ORSA results be compared to sector-specific studies?
BC ORSA results are not directly comparable to sector-specific studies. Some outdoor recreation sectors, including ski areas, heli-skiing, and snowmobiling, have conducted their own economic impact studies. These studies differ in underlying assumptions, aggregation of categories, scope, and methodology. As a result, their findings are not directly comparable to BC ORSA results. Readers interested in understanding specific differences should consult the authors of those sector-specific studies.
Historical research and surveys
BC Outdoor Recreation Participant Survey
This study offers a detailed picture of how and where people engage in outdoor recreation across British Columbia, who participates, why they do it, and which activities are most popular.
Research and insights
Before the development of B.C. ORSA, the Province conducted the Outdoor Recreation in BC: Participation and Economic Insights study. Published in 2025, that research explored outdoor recreation participation across British Columbia, including the activities people enjoy, barriers to participation, and the economic impacts associated with outdoor recreation at that time.
The BC ORSA builds on this earlier work. While the participation study provided a snapshot of outdoor recreation, the BC ORSA is designed as an ongoing measurement framework that can be updated annually. It draws on a broader range of data sources, including Statistics Canada economic data, government information, economic modelling, and sector research to produce consistent estimates of outdoor recreation's contribution to the provincial economy.
BC ORSA also captures a wider range of economic activity, including outdoor recreation experiences, recreation-related goods and equipment, government spending, and investment activity. This more comprehensive approach provides a deeper understanding of the size and scope of the outdoor recreation economy and improves the ability to track changes over time. As a result, findings from B.C. ORSA should not be directly compared with results published through the Outdoor Recreation in B.C.: Participation and Economic Insights project.
Expand the tabs below for individual graphics of the findings, select the download link to save the images for sharing on social media.
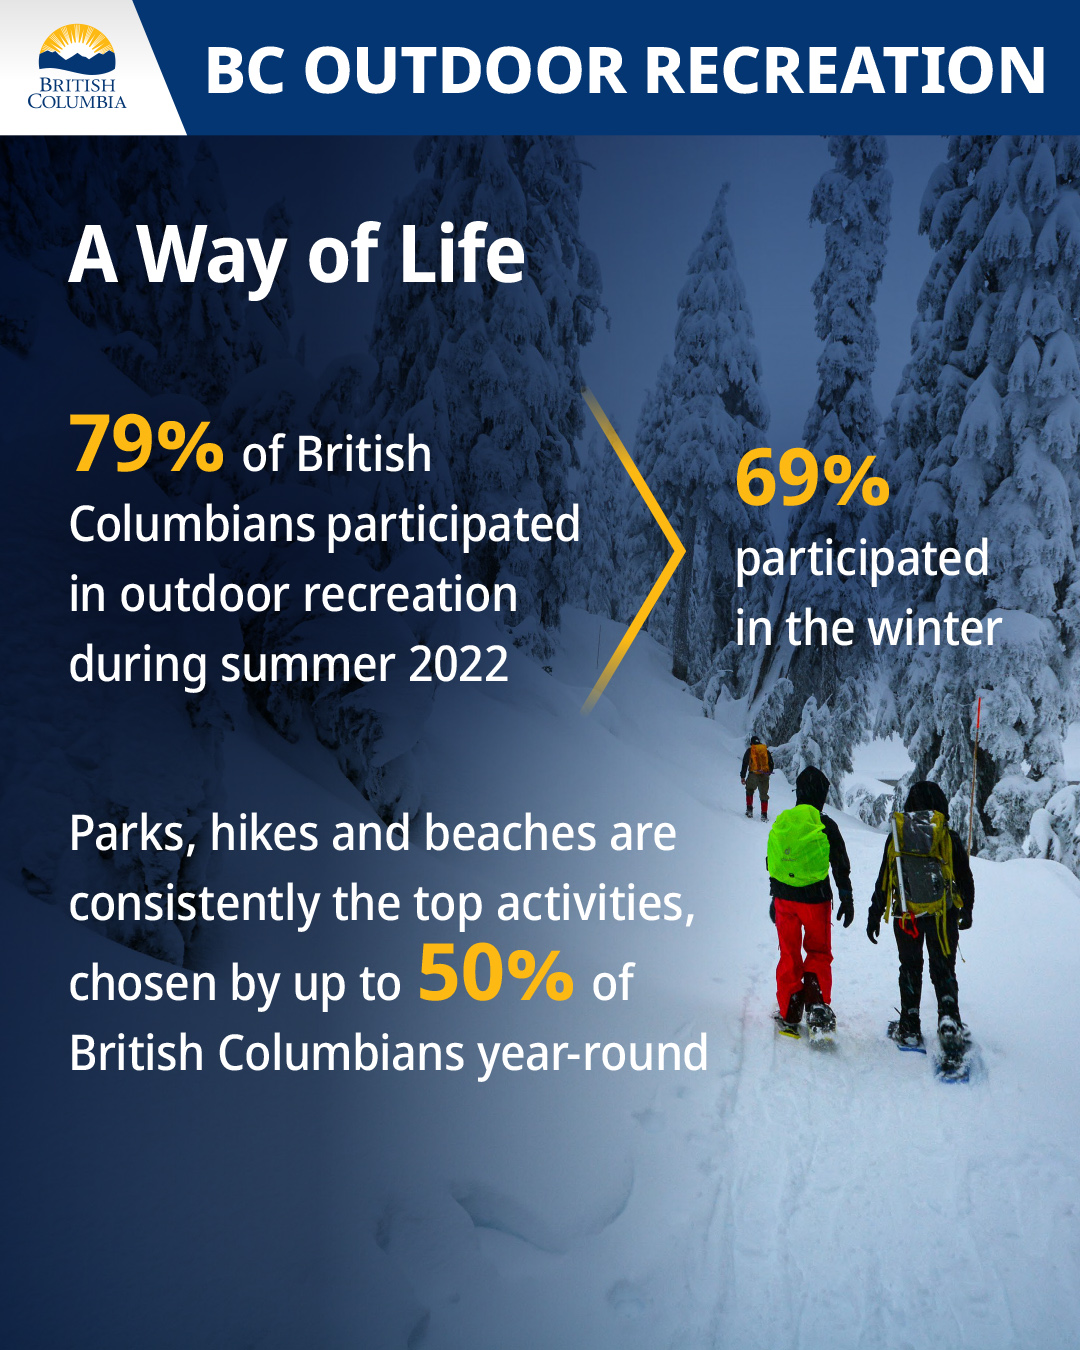
A way of life
Key findings
- 79% of British Columbians participated in outdoor recreation during summer 2022.
- 69% participated in outdoor recreation during the winter.
- Parks, hiking trails, and beaches are consistently among the most popular outdoor recreation activities, with participation rates of up to 50% of British Columbians year-round.
The graphic highlights outdoor recreation as an important part of life in British Columbia, with strong participation across all seasons.
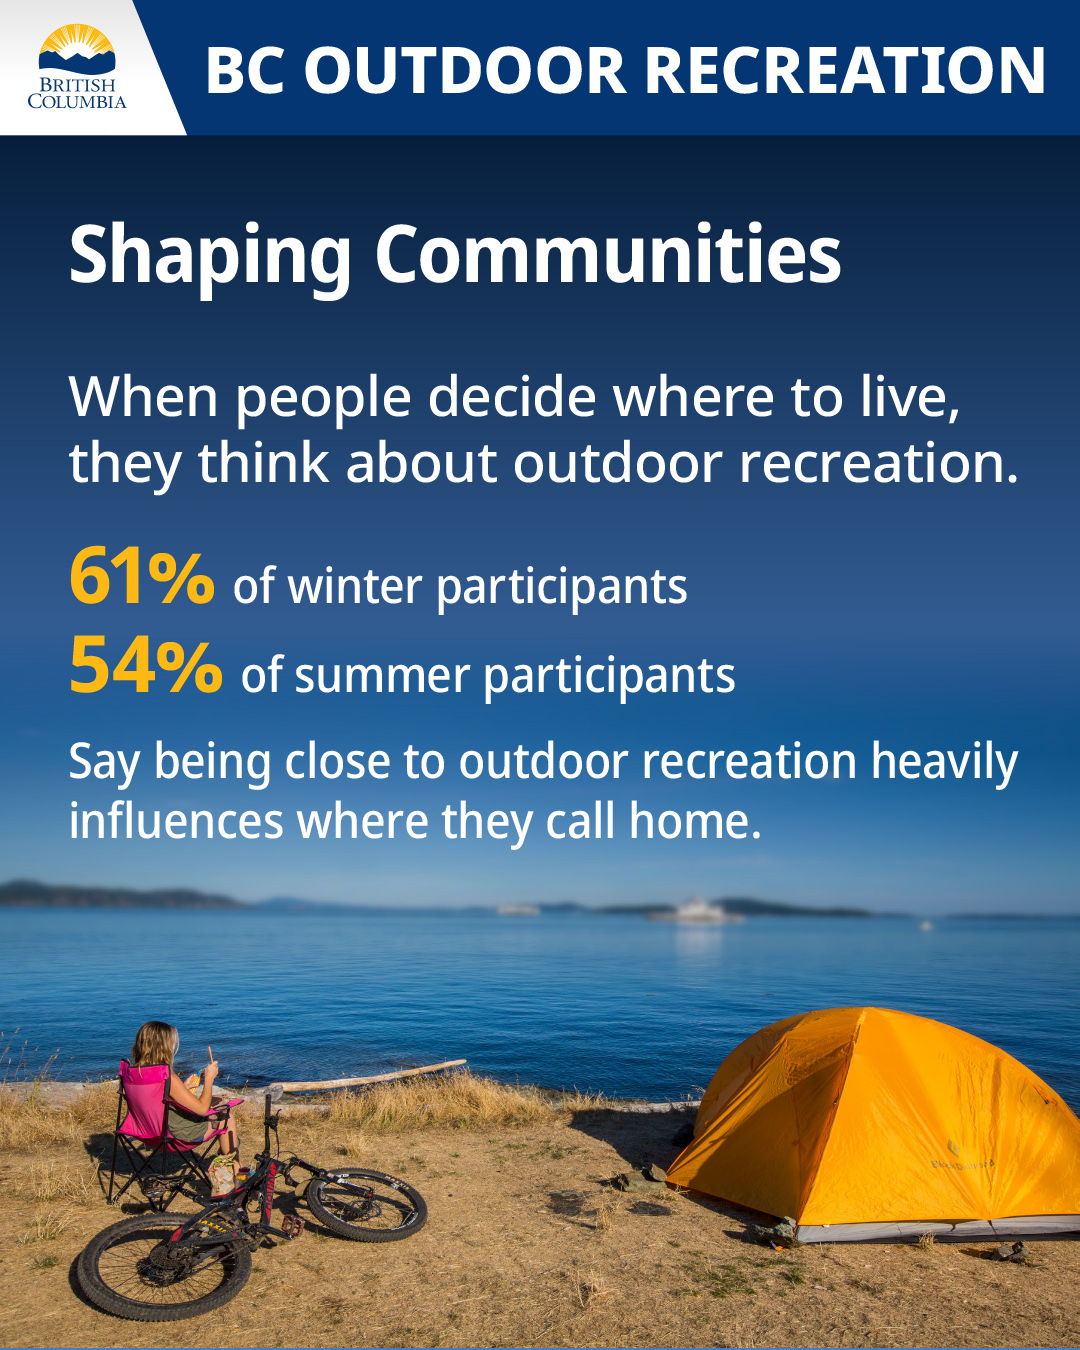
Shaping communities
Key findings
- 61% of winter outdoor recreation participants say proximity to outdoor recreation heavily influences where they choose to live.
- 54% of summer outdoor recreation participants say proximity to outdoor recreation heavily influences where they choose to live.
The graphic highlights the role outdoor recreation plays in shaping communities and residential choices, with many British Columbians considering access to outdoor recreation when deciding where to live.
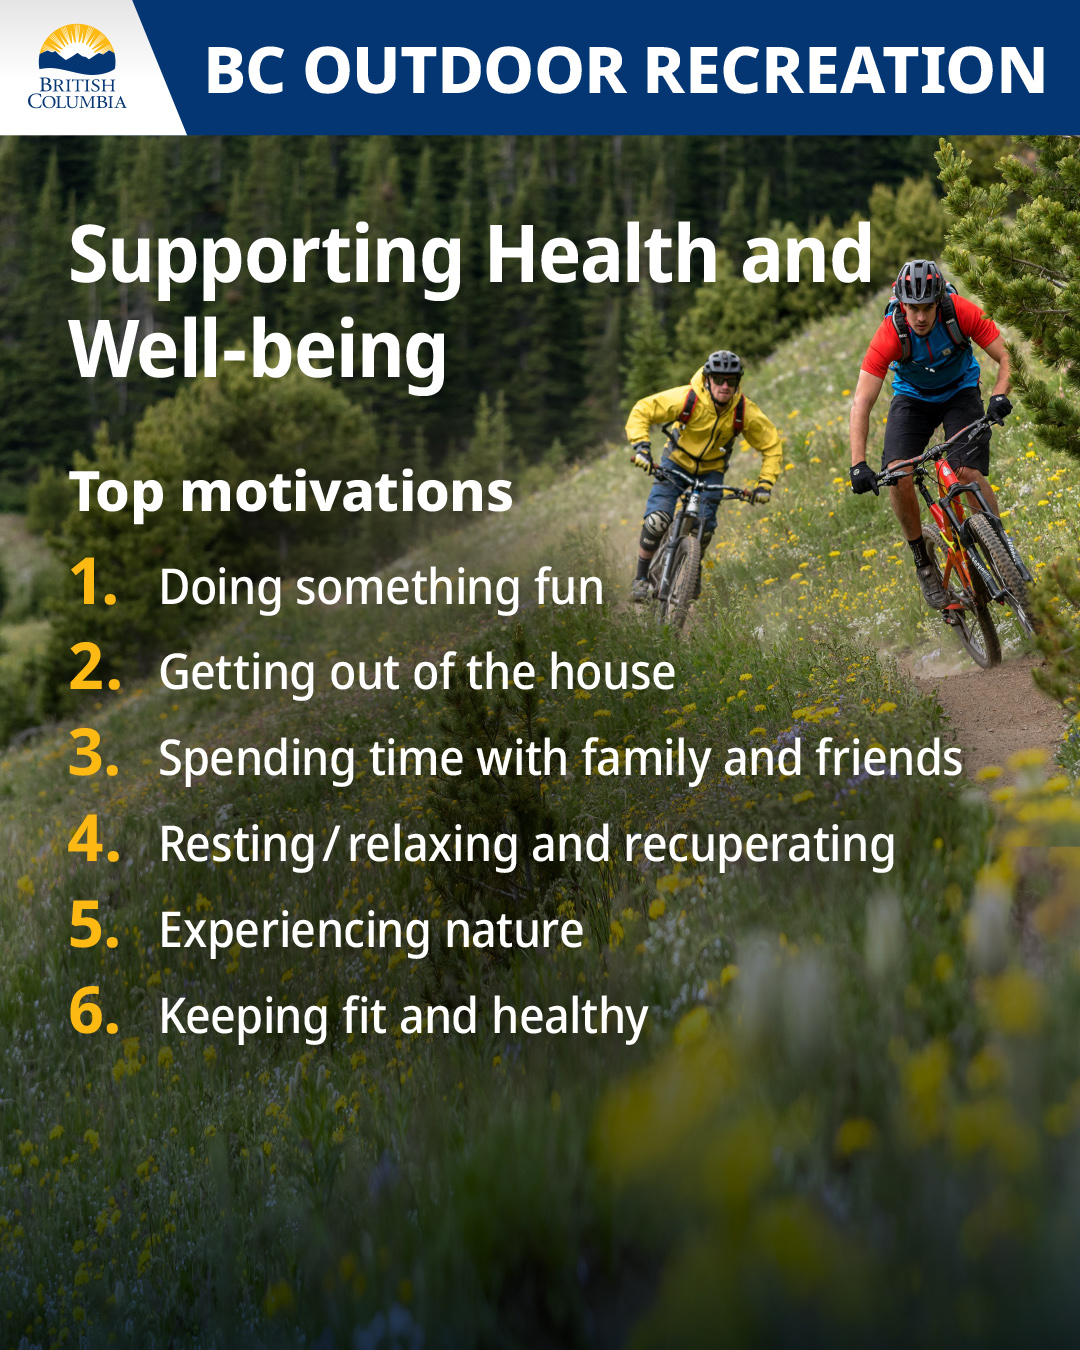
Supporting health and well-being
Top motivations for participating in outdoor recreation
- Doing something fun
- Getting out of the house
- Spending time with family and friends
- Resting, relaxing, and recuperating
- Experiencing nature
- Keeping fit and healthy
The graphic highlights the important role outdoor recreation plays in supporting health and well-being, with participants motivated by enjoyment, social connection, relaxation, experiencing nature, and maintaining physical health.
Download the supporting health and well-being graphic (PNG, 2.2MB)