Plots, field methodology and digital data
Plots in the OGD network are permanent, stand-mapped portions of the coastal temperate rainforest that are measured and studied over time.
On this page:
- Locations and characteristics of plots within the OGD network
- Field methodology
- Current and historical spatial layers
Locations and characteristics of plots within the OGD network
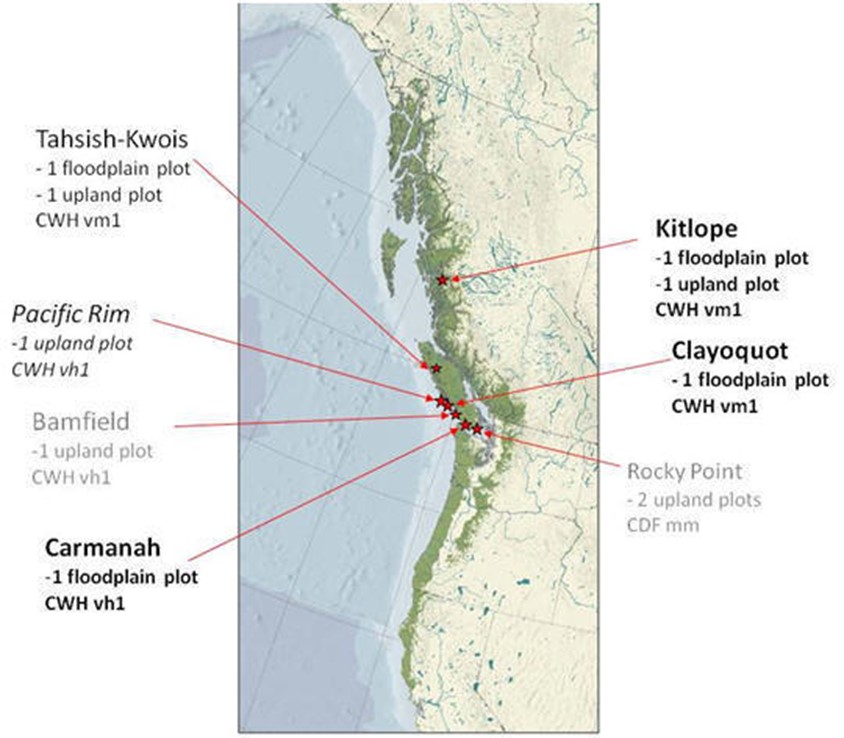
Location of the OGD stand-mapped plots within the historical distribution of the coastal temperate rainforest of western North America (Figure used with permission of Ecotrust).
Review the plot specific photos page for more information.
Carmanah, Clayoquot, and Kitlope Plots:
- Indicates plots established in 1992-3 that have been remeasured in 2007-9
Tahsish-Kwois Plot:
- Indicates plots established in 1992-3 that have not been remeasured
Pacific Rim Plot:
- Indicates new plots to the OGD system (established 2007-9)
Bamfield and Rocky Point Plots:
- Indicates historical plots established by researchers other that Alaback et al. (Bamfield, B. Beasley; Rocky Point; T. Chatwin) that can provide comparative, temporal, stand-mapped data
Field methodology
Plot layout
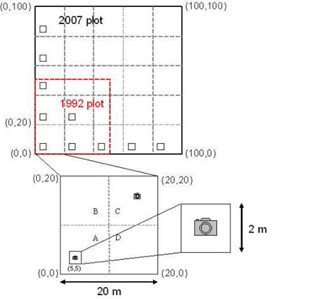
The historic, stand-mapped plots were 0.25 ha (50 x 50 m) in size. Where consistency and extent of the ecosystem being sampled allowed, these plots were expanded to 1 ha (100 x 100 m). Figure 2. illustrates the nesting of the historic Carmanah Floodplain plot within the new, expanded plot. The 1 ha plots were gridded into 20 x 20 m squares (hereafter termed subplots) to complete the100 x 100 m grid (excepting the Kitlope Douglas-fir plot which could not be expanded from its original size). Corners of the plot and subplots were permanently marked.
Design for the 1 ha, Carmanah Floodplain (CAF; 2007):
1 ha old growth plot incorporating the historical (1992) 0.25 ha plot. Understory vegetation and substrate plots were established within each of 20 x 20 m subplot (N=25), with hemispherical photos in the centre of these vegetation plots and in the opposite corners of each subplot (N=50).
Understory Vegetation Sampling
We systematically placed 2 m x 2 m quadrats in the centre of the lower left quarter (a 10 m x 10 m cell) of each 20m x 20m subplot. Percent cover of vascular and nonvascular species within the 2 x 2 m plot were estimated for tree (A), shrub (B), herbaceous (C) and seedling/moss (D) layers (DEIF; BC MoE 1998). In addition to the sublayer totals noted by DEIF, we recorded the percent of the shrub layer cover that was coniferous. We also recorded species that occurred on (were rooted on) CWD, not just those established on the forest floor and described their substrate using the following classes:
- F- occurs only on Forest Floor
- L- occurs only on Logs
- FL-occurs on both Forest Floor and Logs (foliar cover)
Understory Light Environment – Hemispherical Canopy Photos
During 2007 and 2008 field seasons, photos were taken to evaluate variability in light conditions across the stands (Carmanah <Fig. 3> and Kitlope). Canopy photographs and canopy cover class estimates were taken at the centre of each understory vegetation subplot (N=25) and at an additional 25 points located in the upper right (C) quarter of each 20mx 20m grid cell (total locations = 50; minimum distance between photos points = 14.14 m; I. Giesbrecht, pers. comm.). Photos were taken both above shrub height and below shrub height for evaluation of impacts of the shrub layer on growing conditions of the herbaceous understory and seedling regeneration.
Variability in light conditions across stands (Carmanah floodplain hemispherical canopy photos):
Light environment was assessed from the photos using Gap Light Analyzer (Frazer et al. 1999; Frazer et al. 2000).
Measurement of Forest Structure and Composition
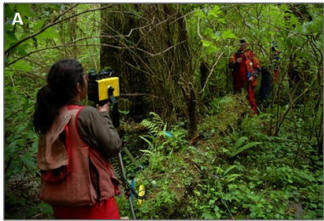
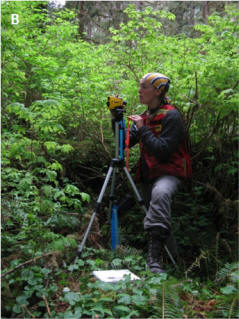
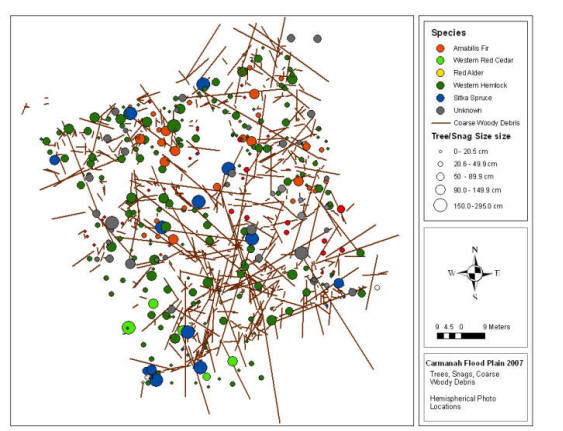
We measured the location of each tree (≥7.5 cm DBH), snag (≥7.5 cm DBH and ≥1.3 m height) and piece of coarse woody debris (CWD, ≥ 7.5 cm diameter and ≥ 1 m length). Locations were recorded as the distance (m) and azimuth (°) of a feature from a known subplot corner.
Mapping the location of structural features:
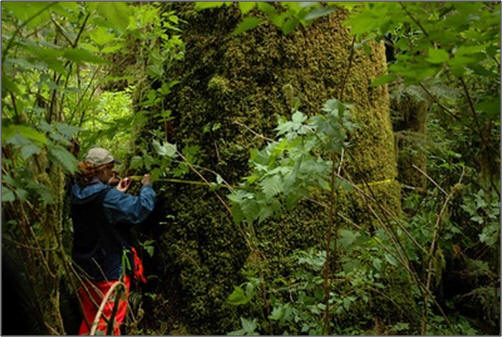
Trees and snags were tagged at 1.3 m height from the point of germination. Coarse woody debris was tagged at the end used to mark the piece location.
Marking coarse woody debris with uniquely numbered tags:
For trees and snags, we recorded species, DBH (See Figure 7), height, and information on morphology (e.g., a big fork or big sweep in the tree) or pathology (e.g., scar, mistletoe). We also recorded decay class (as per BC MFR and BC MoE 2010) and mode of mortality, if possible, for snags (e.g., snap, fungal) and decay class, height above ground, tilt of piece, and diameter of the second end (untagged end, DIAM2) for CWD (BC MoE 1998).
Soil Sampling
One full (>75 cm) soil pit was dug and described outside but adjacent to each permanent plot in association with BEC sampling to characterize these ecosystems.
In addition, humus form was characterized in mini pits (about 20 cm depth) at each understory vegetation plot. Organic soil horizons and upper mineral soil horizons (e.g., Ah, Ae) were evaluated for characterization of humus form.
Literature Cited
- BC Ministry of Forests and Range (MFR) and BC Ministry of Environment (MoE). 2010. Field Manual for Describing Terrestrial Ecosystems, 2nd Edition. Province of BC: Victoria, BC. Land Management Handbook 25.
- Frazer, G.W., C.D. Canham, and K.P. Lertzman. 1999. Gap Light Analyzer (GLA) Version 2.0: Imaging software to extract forest canopy structure and gap light transmission indices from true-colour hemispherical (fisheye) photographs. Simon Fraser University, Burnaby, British Columbia, and the Institute of Ecosystem Studies, Millbrook, New York.
- Frazer, G.W., C.D. Canham, and K.P. Lertzman. 2000. Gap Light Analyzer Version 2.0. Bulletin of the Ecological Society of America 81:191-197.
Current and historical spatial layers
Initial plot surveys were completed in 1992 and 1993, with follow up surveys completed in 2007 - 2009. Stands are scheduled for (third) re-measurement between 2023 and 2025.
Carmanah Floodplain 1992-93 Historical sketch shown with digital spatial map:

