About the Survey Scores
Percentages Versus Average Scores
Each average score is a single number that expresses all the responses to a survey question (from 1 Strongly Disagree to 5 Strongly Agree). We use average scores to summarize the drivers in the engagement model and report out the model results through the house diagram. Without average scores, we could not calculate a score for each driver and engagement characteristic.
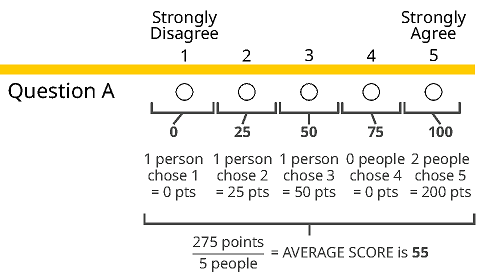
Average scores are calculated by converting the five-point survey scale into a 100-point scale and averaging based on the number of respondents, as shown in the figure below:

We also calculate an average score for each survey question, which helps us determine whether there has been real improvement or not. For example, looking at the table below, can we determine whether there has been an improvement for the question: Work is distributed fairly in my work unit.
| Year | % Disagree | % Neutral | % Agree | Score out of 100 points |
|---|---|---|---|---|
| 2013 | 24% | 25% | 52% | 59 |
| 2015 | 25% | 24% | 52% | 58 |
The percentage of employees who agreed remained constant at 52 percent, however, the percentage of employees who disagreed with the question increased by one percentage point (ppt), which suggests a slight decline in employee experiences.
In terms of average scores, the increase in the percentage of people who disagreed with the question, in combination with the constant year-over-year percentage of people who agreed with the question, likely translated into the observed one point decrease in average scores. It is important to note though, that in this example, neither the percentage point differences nor the average score differences were tested for statistical significance.
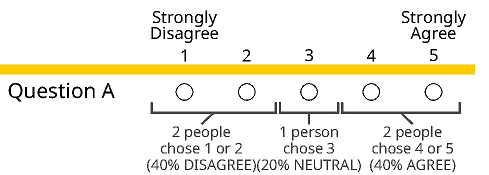
Results are shown as percentages to highlight the distribution of responses per question. The percentages show the proportion of employees who disagreed, agreed or gave a neutral response to the survey question. To calculate these percentages, the number of times an answer was selected by respondents is totaled and collapsed into three categories, as shown in the figure below. Some percentages may not sum to 100 percent simply due to rounding.

Calculating the Average Score for Engagement
The Engagement score is calculated for each respondent. Then the scores are averaged across respondents to produce a single score.
The calculation itself is done in two steps.
Step 1
Calculate a respondent's average score for each of the engagement characteristics. For example, the BC Public Service commitment is calculated from the two underlying questions:
(Commitment Q1 + Commitment Q2) / 2 = Commitment
Step 2
Calculate a respondent's average score for Engagement by taking an average of their scores on the three engagement characteristics:
(Commitment + Job Satisfaction+ Organization Satisfaction) / 3 = Engagement
Once the Engagement score for every respondent is calculated, their scores are averaged together to produce one single Engagement score. We do this by summing all the scores and dividing the total points by the number of respondents. We use the same approach for calculating an Engagement score for every organization, work unit and/or any other respondent grouping.
Employee responses are included in the BC Public Service Commitment score only if they answered both of the questions measuring BC Public Service Commitment. Likewise, the calculation of the Engagement score is based only on those who answered the two Commitment questions as well as the questions measuring Job Satisfaction and Organization Satisfaction. It is important to note that the average scores for individual questions will not equal the Engagement score when averaged together if there is a sizeable amount of respondents who did not answer one or more of the questions (responded with ‘don’t know’ or ‘not applicable’).
Calculating Scores for Drivers
We calculate the average score for each underlying survey question making up the driver. Next we sum the average scores to the underlying questions for each respondent and divide by the total number of questions making up that driver. We then sum the average score for all respondents and divide by the number of respondents.
View an example
Based on one respondent’s feedback, the three survey questions that underlie the Teamwork driver have the following average scores:
- When needed, members of my team help me get the job done (75)
- Members of my team communicate effectively with each other (65)
- I have positive working relationships with my co-workers (78)
The Teamwork driver score for this respondent is calculated by adding these three average scores and dividing by three:
(75 + 65 + 78) / 3 = 73
This respondent’s score is averaged with all other respondents who provided answers to the questions making up Teamwork to produce the overall average score for this driver.
A similar averaging process occurs for all the drivers in the model. It is important to note that the average scores for underlying questions will not equal the driver score when averaged together if there is a sizeable amount of respondents who did not answer one or more of the questions (responded with ‘don’t know’ or ‘not applicable’).
How to Use the Numbers
The average scores and percentages were designed to be used together when interpreting the reports. Use the following process to step through the results:
Step 1
Turn to Table 2: Question by Question Model Results of the Exploring Employee Engagement report for your organization and/or work unit. Review the average score for each driver to identify the highest and lowest scoring drivers.
Step 2
Review the average scores for the survey questions that underlie the drivers. For some drivers, the average scores for the questions measuring the driver may be similar (for example, Recognition, Staffing Practices). For other drivers, the average scores for each question item may be quite different. For example, there is often a 10- to 15-point gap between the average scores for the questions underlying the Teamwork driver.
Step 3
Use the percentages in this table to better understand the response patterns associated with the average scores. Are there many neutral answers or are the responses strongly polarized into disagree and agree?
Comparing Scores
Making Baseline Comparisons
The year-over-year comparisons of survey responses provided in the reports are only ballpark signals indicating the amount of change that may or may not have occurred since the previous survey cycle. These year-over-year comparisons have not been tested for statistical significance. Therefore, any positive or negative changes identified in these reports could be due to other factors outside of employees’ perceptions. For example, the year to year differences in population sizes, response rates and organizational structure may be playing a role in influencing changes in scores.
As a result, interpreting changes solely by looking at year-over-year comparisons from the reports could be misleading because none of these factors have been taken into account. In order to evaluate whether changes in perceptions have occurred over time, a set of statistical tests needs to be conducted to determine whether changes are statistically significant. For further information about these statistical tests and how to apply them to year-over-year comparisons, please contact BC Stats.
Benchmarking with Others
While the organization reports contain year-over-year comparisons, work unit reports do not. The structure of work units can significantly change between survey years. This includes employee re-assignments to, from, and within departments. In many cases, there is no direct mapping between current work units and work units reported in the past due to reorganizations. Therefore, BC Stats does not publish year-over-year comparisons in work unit reports. However, if you know that your work unit has been stable since the previous year, you can calculate year-over-year comparisons using your previous year’s report if it is available. Contact your Strategic HR group for more information.
ERAP Narrations Videos
Confidentiality
Related Links
Contact information
Contact us for more information about these statistical tests and how to apply them to year-over-year comparisons.
