Local Area Economic Profiles
The Local Area Economic Profiles (LAEP) provide consistent, localized insights to help users understand the economic structure, trends, and dependencies of communities across British Columbia.
On this page
- Local Area Economic Profiles (LAEP)
- LAEP Toolkit and Dashboard
- Resources
- Economic Modelling of Local Areas
- Contact us
Local Area Economic Profiles (LAEP)
The LAEP model helps understand how different areas in the province are economically connected. The model identifies 103 local economic areas that include all municipalities and regions in B.C.
The LAEP provides a detailed picture of each area's economy, including:
- Labour force characteristics
- Income and earnings
- Industry structure and specialization
- Economic dependencies and multipliers
These insights are very useful for:
- Identifying economic strengths and weaknesses
- Supporting policy development and planning at the community level
- Exploring different scenarios and how they might affect communities across B.C.
You can read the full report (PDF, 3.2MB) for an in-depth look or check out the highlights report (PDF, 2.2MB) for a quick overview.
LAEP Toolkit and Dashboard
The LAEP Toolkit (XLSX, 4.1MB) can help you explore and apply the LAEP model. This free, downloadable Excel-based tool generates custom profiles and simulates economic changes at a local level. The LAEP Toolkit makes it easy to learn about local economies in B.C. and see how different changes could affect your community, using clear and reliable data.
The Toolkit includes two main components:
- LAEP Calculator: Estimates the economic impact of hypothetical situations, like opening a new business or changes in local jobs.
- The Profile Generator: Gives a quick look at the economy in any of B.C.'s 103 local areas or 29 regional districts, with customizable charts and comparisons to other regions.
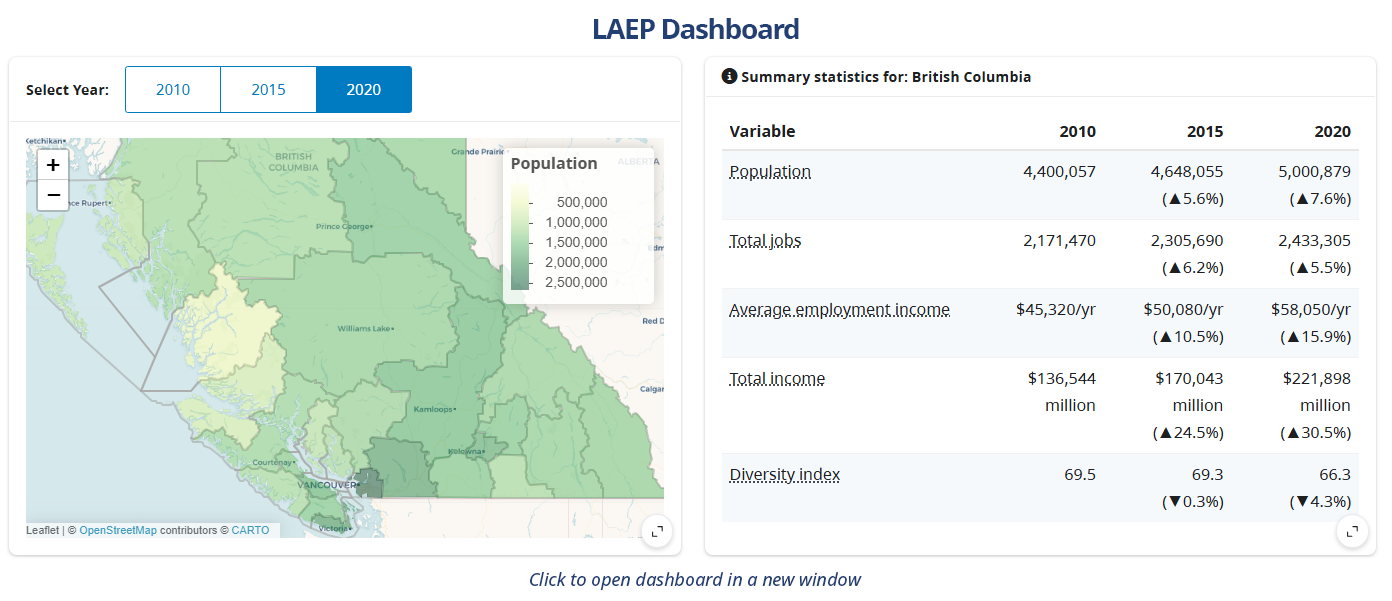
The LAEP Dashboard is an online interactive map that lets users explore the LAEP data. It provides a user-friendly way to explore economic insights across B.C. and an accessible starting point to engage with local economic data.
Resources
- 2025 LAEP Full Report (PDF, 3.2MB)
- 2025 LAEP Highlights Report (PDF, 2.2MB)
- 2025 LAEP Toolkit (XLSX, 4.1MB)
- LAEP Dashboard (Opens in a new window)
- LAEP FAQs
- LAEP Livestream - July 15, 2025 (Opens in a new window)
Economic Modelling of Local Areas
The LAEP uses an input-output modelling methodology to estimate how changes in one part of the economy can ripple through others.
BC Stats uses detailed data from Statistics Canada and its own custom algorithms to estimate:
- Direct, indirect, and induced impacts
- Employment and income multipliers
The LAEP builds on the old Local Area Economic Dependencies model, and it is a significant update in both geographic coverage and analytical approach.
CSV versions of the LAEP Toolkit can be found on the BC Data Catalogue:
Contact us
If you would like to discuss this project further or would like more information, you can connect with us through the BC Stats request system.

