Old growth maps
The maps below reflect the data provided by the Old Growth Technical Advisory Panel and definitions as outlined in the panel’s report.
For access to spatial data, including shapefiles, visit the FTP. Please note these files require specialized mapping applications. For PDF maps, use the links below.
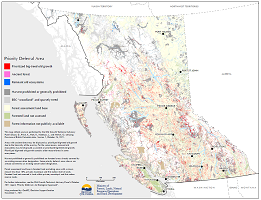
Map 1: Priority Deferral Area
This map shows an overall picture of our priority recommendations for harvest deferral. It combines the Prioritised Big-treed Old Growth (Map 3), Remnant Old Ecosystems (Map 4) and Ancient Forests (Map 5) maps. Areas meeting the criteria in each category are identified whether they are already protected or not. All of the area noted on this map, outside protected areas, are at high near-term risk and should have harvest deferred.
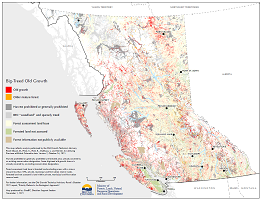
Map 2: Big-treed Old Growth
Big-treed old growth is naturally rare. And, since it has been heavily targeted by harvesting, big-treed old growth is now very rare compared to its historic distribution, putting it at extremely high near-term risk. We mapped the biggest-treed remaining old growth (measured by stand height and diameter) in each ecosystem4 up to a given target. We developed two target levels: a) a default target consistent across all ecosystems, and b) a priority area with reduced targets for ecosystems at lower risk. This smaller area (b) of big-treed old growth is included in the Priority Deferral Map (Map 1).
This map shows the remaining old forest with the largest trees in each ecosystem, as described by tree height and diameter. For each ecosystem, the map shows the greater of the biggest remaining old forest up to 10% of the forested area, or up to 30% of the naturally expected amount of old, reflecting ecological variability in the natural historic distribution of old forest. Research shows that when 30% or less of the historic distribution of an ecosystem remains, risk to biodiversity and ecosystem function is high—so this map shows the area of old forest needed to ensure that risk does not cross the high-risk threshold. Many big-treed ecosystems have less than 10%, and some have less than 1%, of the historic distribution of old growth. In these cases, the map also shows the biggest older mature forest to reach the target amount, if possible. Map 2 is not included as a layer in Map 1.
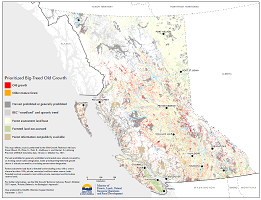
Map 3: Prioritized Big-Treed Old Growth
This map is a subset of Map 2, showing the highest priority big-treed old growth. To create this map, we varied the targets for each ecosystem based on finer-scaled ecological risk. Whereas Map 2 shows the biggest 10% or 30% of expected amount of old for all ecosystems, this map shows the biggest 3 or 5% forests in ecosystems at lower risk, and 7%, 10% or 30% of expected for ecosystems at higher risk. Map 3 is included as a layer in Map 1.
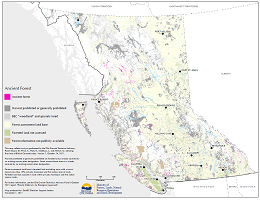
Map 4: Ancient Forest
This category captures the “ancient” category of the OGSR. This category includes forests that have developed without a stand-replacing disturbance for many centuries or millennia. We mapped forest identified as over 400 years old in ecosystems with rare stand-replacing disturbance and over 250 years with more frequent disturbance.
This map shows the forests described in provincial forest inventory data as ancient, defined as older than 400 years (for ecosystems with rare stand-replacing disturbance) and older than 250 years (for ecosystems with higher stand-replacing disturbance rates). Map 4 is included as a layer in Map 1.
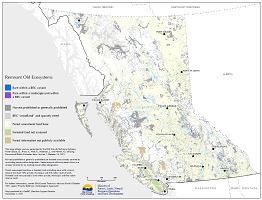
Map 5: Remnant Old Ecosystems
If an ecosystem has been heavily harvested and very little old growth remains, these remnant areas are, by definition, rare. We mapped remnant old growth in ecosystems with less than 10% old remaining, in total and within a landscape unit. Remnant old ecosystems are included in the Priority Deferral Map.
This map shows old forest remaining in ecosystems where less than 10% of the total forested area is mapped as old today, defined as older than 250 years in ecosystems with rare stand-replacing disturbance and older than 140 years more frequently disturbed ecosystems. The map highlights BEC variants where less than 10% of the forest is old, and where geographic areas within these ecosystems (described by landscape units) have less than 10% old forest. Remnant old patches are frequently small and fragmented.
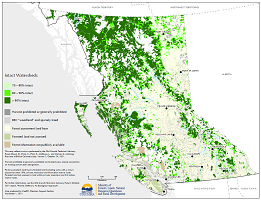
Map 6: Intact Watersheds
This category captures part of the “resilient forest” category of the OGSR. Intact watersheds are free, or largely free, from anthropogenic modification of forest composition, structure, and function. We mapped relatively intact watersheds (70%, 80%, 90% intact measured in freshwater assessment watersheds10) across B.C.
This map shows relative watershed intactness based on the amount of logging and roads in each watershed. Colours on the map differentiate amongst watersheds that are more than 70%, 80% and 90% unmodified. Map 6 is not included in Map 1 but is provided to assist planning.
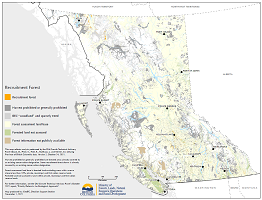
Map 7: Recruitment Forest
Where insufficient big-treed old forest remains to fill minimum targets (see above), we identified recruitment forest using the same methods but choosing forest from a younger age-class (age 80 and older).
Ecosystems with little or no remaining old forest face the highest risk in the province. Reducing risk in these highest risk ecosystems requires recruiting appropriate younger forest to grow old. Although the Provincial government has not committed to deferring recruitment forest, where insufficient old and older mature forest remain to meet minimum targets, Map 7 shows younger forests (over 80 years) where the provincial inventory identifies the largest trees that could “recruit” into large-structured old forest in the shortest timeframes. The mapping does not identify stands with veteran trees that are older than the main forest canopy. Forests with veterans may be important for recruitment.
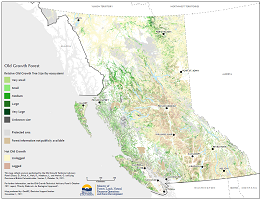
Map 8: Old Growth Forest
This map provides context for the deferral maps, showing all forest identified in provincial forest inventory as old growth (older than 250 years in ecosystems with rare or infrequent stand-replacing disturbance and older than 140 years in ecosystems with higher stand-replacing disturbance rates). It highlights relative tree size, as described by tree height and diameter, by dividing old growth within each ecosystem into five equal size classes. The area of forest in each size class varies because there are more small and medium-sized trees than large trees. See inset graph showing area by class. The map provides additional context by discriminating between younger stands initiated by logging and those initiated by natural disturbance.

