Horizontal Coordinate Refresh
Attn. Users of Geodetic Control Monuments (GCMs) in Powell River ISA
January 17, 2022
1. Background
A horizontal refresh of the Powell River ISA was published on January 4th, 2022. On average, horizontal coordinates were corrected by 0.36m. The corrections have yielded a more accurate realization of NAD83(CSRS) 4.0.0.BC.1 throughout the ISA. Corrections were not constant throughout the ISA nor could they be defined by a set of simple transformation parameters. Instead a grid shift model was derived to account for the unpredictable varying shift corrections that were required throughout each pocket of the network.
The ISA was originally established via terrestrial observations during the late 1970s/early 1980s. These terrestrial observations had been used and recycled to arrive at previous iterations of horizontal datum realizations: NAD27, NAD83 Original, NAD83 (CSRS98). In 2006, those original terrestrial observations were once again recycled during the original attempt to integrate the ISA into NAD83(CSRS) 4.0.0.BC.1. These values remained published from 2006 until January 4th, 2022. Unfortunately, those municipal terrestrial observations did not have any immediate connection to nearby points having accurate (GNSS-derived) NAD83(CSRS) 4.0.0.BC.1 values. Instead, the ISA was integrated into the datum via historic terrestrial traverses spanning great distances before finally being connected to monuments accurately integrated into the datum. Due to the error accumulation over very long historic traverses, there was (on average) a 0.36m systematic bias throughout the ISA since NAD83(CSRS) 4.0.0.BC.1 was officially adopted. The 2022 refreshed realization of NAD83(CSRS) 4.0.0.BC.1 is based on direct GNSS observation at 46 GCMs within the ISA. The occupied monuments were directly connected via multiple baselines to Federal CACS and Provincial BCACS stations thereby providing a direct link to an accurate realization of the official datum. As a result, the accuracy with respect to the datum has been greatly improved. The refreshed values will show substantially better compatibility with independent GNSS-derived positions. E.g. baseline observations to official active control stations or positions derived from NRCAN’s CSRS-PPP service.
Click on each of the links in Table 1 below to download PDF drawings that illustrate the horizontal changes applied throughout the ISA.
| ISA Drawings |
|---|
| Full ISA |
| Wildwood / Historic District |
| Historic District / Westview |
| Westview |
| Network Strain |
Table 1: PDF Drawings Showing Correction Vectors and Network Strain
2. Accurate Realization of NAD83(CSRS) 4.0.0.BC.1 in Powell River
In 2018, a GNSS field survey was conducted, resulting in a highly redundant network of static GNSS baselines connecting 11 GCMs spread throughout the ISA. This network was connected to high accuracy Federal and Provincial active control stations in the region.
The results of the static campaign were later held fixed for the local RTK survey which generated positions for an additional 36 stations. Multiple static stations were later used as RTK base stations. The RTK data had a lower precision than the static GNSS dataset. However, the additional RTK data added definition to the corrective model and was therefore beneficial to the end product. The appropriate corrections throughout the network varied substantially and the additional RTK data provided information that otherwise would not have been feasible to acquire.
The refreshed published values were divided into 3 classes. This information is listed on MASCOT long forms:
- Class A: 11 static GNSS-derived coordinates
- Class B: 36 RTK GNSS-derived coordinates
- Class C: 170 model-derived coordinates
3. High Accuracy Class A Framework
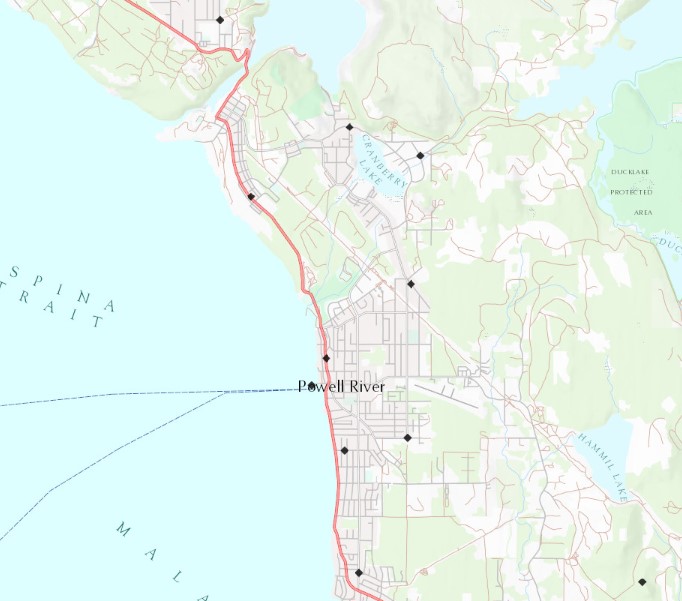
Figure 1 and Table 2 show the new network of Class A GCMs throughout Powell River. These GCMs will now serve as the highest order of geodetic control in Powell River and the qathet Regional District. The survey method (static GNSS) to derive their refreshed positions is the more reliable than the RTK-derived and model-derived positions. High accuracy applications should therefore be referenced to this network rather than Class B & C monuments. There may be some instances where the new published values of Class B and C monuments are found to be poor. Such instances should be reported to GeoBC via Marker Condition Reports. In reporting issues to GeoBC, best practice would be to reference your findings to at least 2 GCMs within the Class A framework.
| GCM | Tablet | Status as of Jan 4th, 2022 |
|---|---|---|
| 971176 | 79H0788 | Good |
| 363556 | 79H0800 | Good |
| 229146 | 82H4761 | Good |
| 697938 | 79H7057 | Destroyed |
| 765321 | 79H7096 | Good |
| 577783 | 79H7117 | Good |
| 336008 | 79H7129 | Good |
| 974717 | 79H7172 | Good |
| 141242 | 79H7201 | Good |
| 880039 | 79H7210 | Good |
| 839555 | 79H9680 | Good |
| 301424 | 907007 | Good |
Table 2: Class A Monuments

Figure 1: Class A Framework
Table 2 shows that 697938 has already been reported as destroyed as of January 4th, 2022. As with all passive geodetic infrastructure, this high order framework is expected to slowly deteriorate over time.
Table 3 (below) provides a list of outlier GCMs. Two of the Class A monuments listed in Table 2 are also listed in Table 3: 229146 and 697938. The outlier status of these GCMs does NOT imply that the new values have poor accuracy. The new values for these GCMs form part of the ISA’s framework of high order of geodetic control. Their outlier status assigned to these 2 GCMs has to do with poor historic fit (of previously published values) with neighboring sample points. These 2 GCMs should be considered equal to any other monument within the Class A framework.
4. Design of the Corrective Model
In order to correct the remaining 170 points not directly observed in 2018, a grid shift model was developed. The Empirical Bayesian Kriging (EBK) interpolation method was used to generate corrections for the remaining 170 GCMs. EBK is a geostatistical interpolation method utilizing the statistical properties of the measured sample points to derive corrections throughout the model.
After assessment of the dataset, 10 of the sample points were declared outliers; the corrections applied to these stations were not treated as representative of their neighboring points in the ISA. Outliers were therefore not used as input into the model. There are multiple reasons why a monument would be an outlier; determining the underlying cause for each individual monument is a difficult task.
Some common causes for monuments to become outliers:
- Outlier monuments could have been disturbed since the time of their original terrestrial observations.
- The ground surrounding the monument could have been unstable causing the monument to move since the time of original observations.
- There were 5 monuments (discussed in Section 7 of this bulletin) that were not historically integrated into the ISA. The modelling correction approach only works for monuments that are historically integrated into the ISA. Lacking this integration, monuments that historically had independently derived positions were outliers with respect to the corrective model.
- Lastly, there is always the possibility of errors within the original (or current) datasets
This left a total of 36 “good” horizontal points remaining. These were used as model constraints. The main criteria to identify an outlier was based on a comparison of a given monuments correction relative to corrections at other neighboring sample points. The goal was to avoid creation of a model that would warp portions of the network by forcing a fit to monuments that show evidence of possible disturbance/deformation.
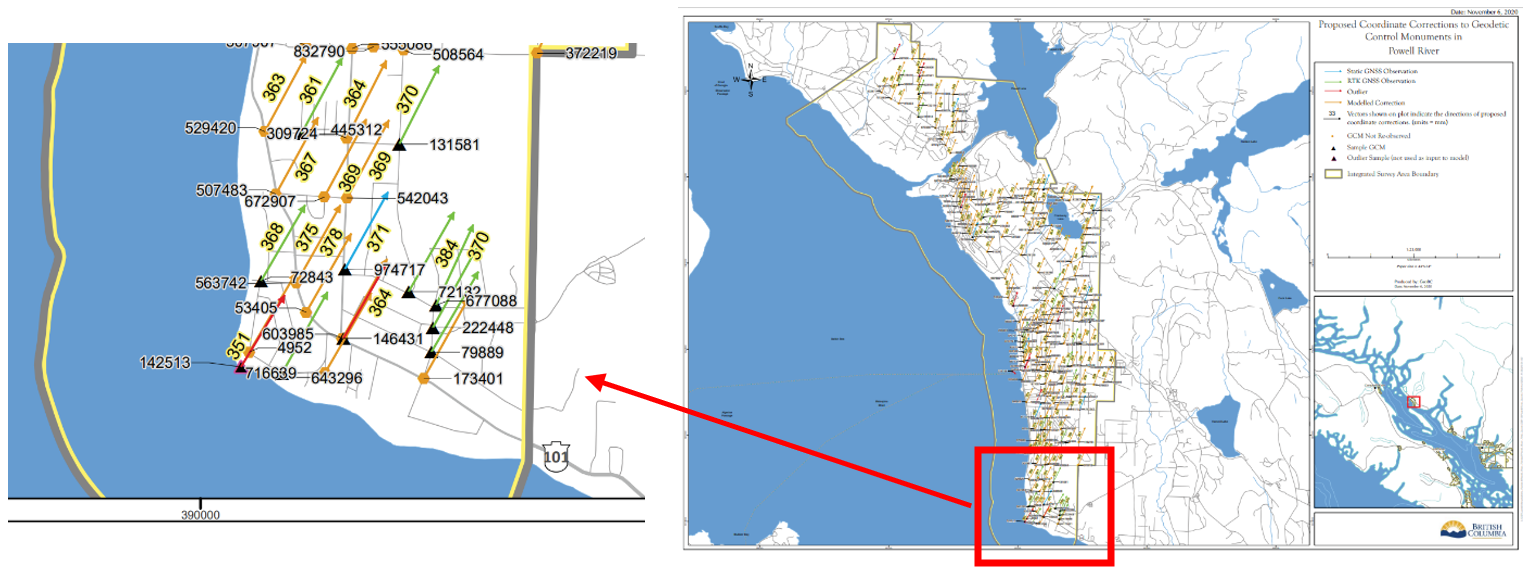
The vector drawings listed in Table 1 were generated to visualize the magnitude and direction of horizontal correction vectors throughout the entire ISA. The total shift values in millimeters are annotated along each shift vector. Vectors are also assigned various colours that indicate a given points status with respect to the correction model:
- Blue vectors represented points derived via static GNSS observation in 2018.
- Green vectors represented points derived via RTK GNSS observation in 2018.
- Red vectors represented outlier GCMs (observation method was either static GNSS or RTK GNSS) observed in 2018.
- Orange vectors were non-observed points. These points received modelled corrections.
Each point has also been labelled with its unique GCM ID.

Figure 2: Shift Patterns at South End of ISA
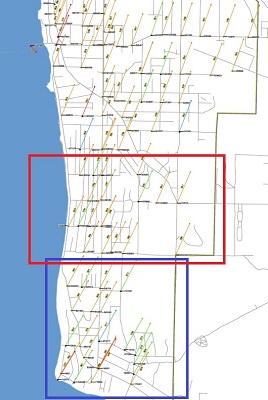
Shift patterns were examined throughout the ISA. Some irregular patterns were identified. Two pockets in the south end of the ISA exhibited behavior that was notably different from the remainder of the ISA north of Lytton St. As shown in Figure 3 below, each zone has its own unique correction to the Easting values. Corrections to Northings were fairly consistent across the ISA, with a range of 0.32m to 0.35m. Meanwhile Easting corrections had a larger range going from 0.12m to 0.19m. The boundaries shown in Figure 3 are “fuzzy”; corrections gradually transition from one zone to the next.

| Zone | Mean dN(m) | Mean dE (m) |
|---|---|---|
| Remainder of ISA (north of Lytton St) | 0.34 | 0.12 |
| Red Block | 0.33 | 0.14 |
| Blue Block | 0.33 | 0.18 |
Figure 3: Shift Patterns at South Half of ISA
5. Applying Correction to Archive Datasets
Handlers of archive datasets must be cautious when attempting to apply corrections to old projects. Any such conversions should be derived based on the published horizontal shifts at nearby monuments with some important exceptions noted below. The exceptions: monuments observed during 2018 that were flagged as horizontal outliers. Outliers showed corrections that did not agree well with shifts observed at neighboring sample points. These misfit monuments did not contribute to the correction model because their observed shifts were assessed to not be representative of the systematic bias within the 2006 datum realization attempt. For this reason, shifts published at outlier monuments should NOT be used for any conversions of datasets. Table 3 below shows the discrepancies that published corrections have with the estimated (model-derived) correction at these locations. In these instances, the model-derived shift can be assumed to be the more accurate of the two.
| GCM | Original Survey Method | New Survey Method | dN (m) | dE(m) | Expected dN (m) |
Expected dE (m) |
Observed dN vs Expected (m) | Observed dE vs Expected (m) |
|---|---|---|---|---|---|---|---|---|
| 229146 | Static GNSS | Static GNSS | -0.07 | 0.07 | 0.33 | 0.12 | -0.40 | -0.06 |
| 142513 | Terrestrial | RTK GNSS | 0.30 | 0.18 | 0.33 | 0.19 | -0.03 | -0.01 |
| 383984 | Terrestrial | RTK GNSS | 0.31 | 0.10 | 0.34 | 0.12 | -0.03 | -0.02 |
| 923540 | Terrestrial | RTK GNSS | 0.32 | 0.09 | 0.34 | 0.12 | -0.02 | -0.03 |
| 625913 | Terrestrial | RTK GNSS | 0.36 | 0.12 | 0.34 | 0.12 | 0.02 | 0.00 |
| 146431 | Terrestrial | RTK GNSS | 0.32 | 0.18 | 0.33 | 0.18 | -0.02 | -0.01 |
| 282046 | Terrestrial | RTK GNSS | 0.32 | 0.13 | 0.33 | 0.13 | -0.01 | 0.00 |
| 697938 | Terrestrial | Static GNSS | 0.34 | 0.13 | 0.33 | 0.13 | 0.01 | 0.00 |
| 307850 | Terrestrial | RTK GNSS | 0.35 | 0.13 | 0.34 | 0.12 | 0.01 | 0.01 |
| 443341 | Terrestrial | RTK GNSS | 0.32 | 0.12 | 0.33 | 0.12 | -0.01 | -0.01 |
The error budget of a given dataset must be taken into consideration before converting in the manner described. As well, it should be assessed whether datasets were constrained to outlier monuments in the past – if that was the case, then the appropriate conversion would be different than what is described here.
The manner in which a dataset is converted should be clearly marked on any plans or documents. For high precision applications, consider resurveying archive project control relative to nearby GCMs. A resurvey will be the most reliable means of integration with the revised NAD83(CSRS) 4.0.0.BC.1 realization in the ISA. As per routine standard procedure, surveyors are advised to occupy multiple GCMs and compare their observations with published values in order to detect erroneous published values. This is especially important for the outliers listed in Table 3. As mentioned above, it is expected that surveyors will now see better agreement in relative dimensions between outliers and their adjacent monuments. However, this assumption has not been field tested. If the new relative dimensions between outliers and their neighbors are found to be poor, this should be reported to GeoBC for further review. After having considered the cautions above, click here for a listing of the dN, dE, dH changes applied to each monument in the ISA.
6. Quality Control of the Model
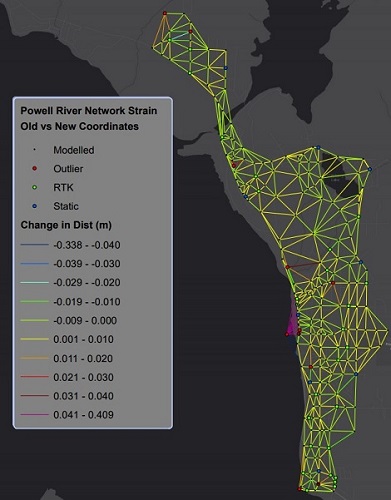
In areas where sample points have large variability, the model was forced to either stretch or compress dimensions between adjacent monuments in order to best fit to the constraining sample points. Small changes to previously published dimensions in the Survey Connections field are to be expected as a result of the refresh. This can be described as Network Strain. As can be seen in the Network Strain drawing, dimension changes between adjacent monuments was less than 0.01m for most of the ISA.
The colour-coded “baselines” on the Network Strain plot represent the changes in the computed distance between station-pairs as a result of the horizontal refresh. The “baselines” shown do not represent actual survey observations made during the 2018 GNSS campaign. Baselines showing strain that exceeded 1cm were examined as a modelling quality control measure. Outliers are shown on the Network Strain drawing with red circles. All baseline connections to outliers show large strain on the Network Strain Drawing. Corrections applied to outliers were substantially different from corrections at neighboring monuments. Therefore, large changes to relative dimensions (between outliers and their neighbors) was expected.
The biggest outlier in the network was GCM 229146 (tablet 82H4761) where the strain was on the order of 40cm. This GCM is near the end of the Westview pier, and was originally set as ground-control for aerial mapping in 1982. On the Network Strain Drawing it has multiple magenta-coloured baselines illustrating the 40cm strain. At some point during the monument’s history, GPS observations were used to establish a 3D position. The GPS derived position was not integrated with the ISA and therefore required a very different correction by comparison with neighboring GCMs.

Table 4 lists 5 GCMs within the ISA that were either part of historical regional mapping projects, or Canadian Hydrographic Service (CHS) coastal traverses. Each of these have no apparent connections to Powell River’s ISA network. Further to this, they were not occupied during the 2018 campaign. As a result, these could not be refreshed during the modelling process. Doing so would apply meaningless corrections because appropriate corrections for these monuments remains unknown. Leaving them as-is in MASCOT has the potential to cause confusion and errors. The following 5 GCMs have therefore been pulled from public view on the MASCOT website:
| GCM | Tablet Marking |
|---|---|
| 192617 | 131 |
| 437392 | 132 |
| 654814 | 82HPOW |
| 726661 | --- |
| 785022 | NO MARKING |
Table 4: GCMs Not Integrated Into ISA
If new observations can be supplied for these monuments, GeoBC can consider posting them back onto the MASCOT website with new accurate values.
8. Data Discrepancy Published in December 2020
There was a data discrepancy (affecting horizontal values) on long forms for Powell River ISA monuments published on MASCOT in December 2020 which was present until the ISA refresh on January 4th, 2022. Please contact GeoBC for further details.
