
Adaptation and drug administration - data
The monitoring and evaluation data below illustrates the uptake of:
- Prescription adaptations by B.C. pharmacists since updates to College of Pharmacists of BC PPP-58: Adapting a Prescription in August 2024, and
- Drug administration in B.C. pharmacies since updates to College of Pharmacists of BC HPA Bylaws Schedule F Part 4, and the introduction of the Drug Administration Fee by the BC Ministry of Health in October 2022
On this page: Adaptations and emergency fills | Drug administrations and publicly funded vaccines | Related links
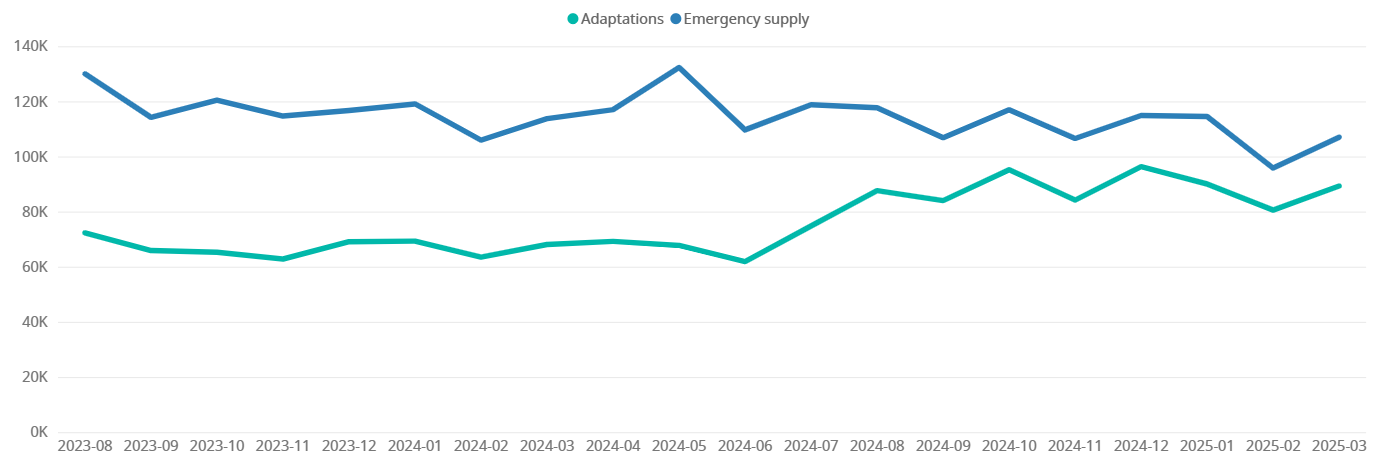
Monthly adaptations and emergency fills by pharmacists
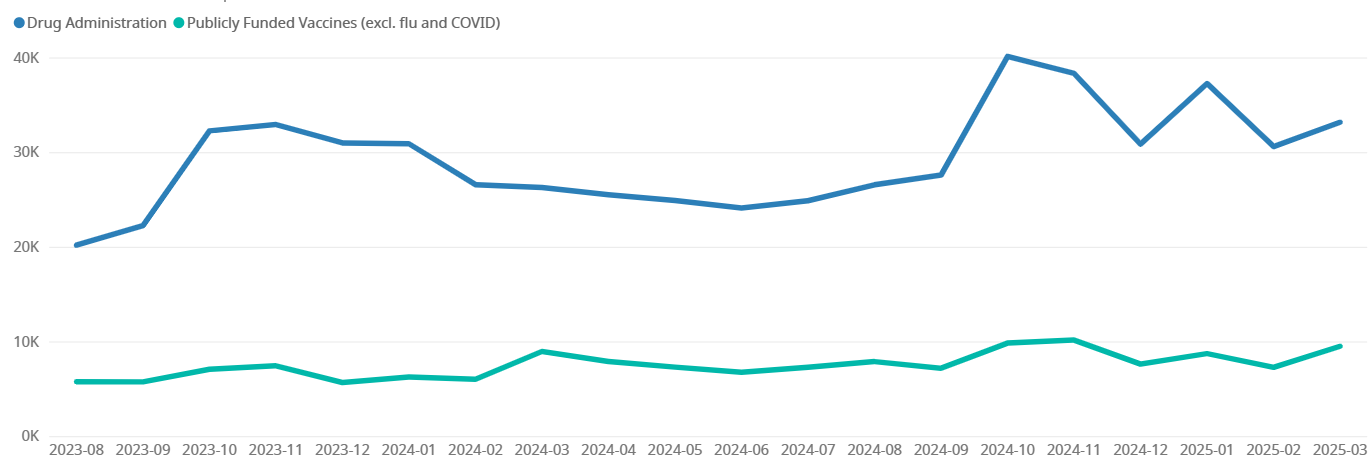
Drug administrations and publicly funded vaccines by pharmacists
| April 1, 2023 – March 31, 2024 | April 1, 2024 – March 31, 2025 | ||
|---|---|---|---|
| Total drug administrations (excl. publicly funded vaccines) | 294,712 | 363,787 | |
| Total publicly funded vaccines (excl. flu and COVID) | 73,962 | 97,315 | |
Data source: PharmaNet, Health Sector Information, Analysis and Reporting Division, Ministry of Health, July 16, 2025

Related links